<?xml version="1.0" encoding="utf-8"?><feed xmlns="http://www.w3.org/2005/Atom" ><generator uri="https://jekyllrb.com/" version="3.10.0">Jekyll</generator><link href="https://fidget-spinner.github.io/feed.xml" rel="self" type="application/atom+xml" /><link href="https://fidget-spinner.github.io/" rel="alternate" type="text/html" /><updated>2026-07-01T23:56:15+00:00</updated><id>https://fidget-spinner.github.io/feed.xml</id><title type="html">Ken Jin’s Blog</title><subtitle>Random Ramblings</subtitle><author><name>Ken Jin</name></author><entry><title type="html">Python 3.15’s Ultra-Low Overhead Interpreter Profiling Mode</title><link href="https://fidget-spinner.github.io/posts/ultra-fast-tracing.html" rel="alternate" type="text/html" title="Python 3.15’s Ultra-Low Overhead Interpreter Profiling Mode" /><published>2026-07-01T00:00:00+00:00</published><updated>2026-07-01T00:00:00+00:00</updated><id>https://fidget-spinner.github.io/posts/ultra-fast-tracing</id><content type="html" xml:base="https://fidget-spinner.github.io/posts/ultra-fast-tracing.html"><![CDATA[<h1 id="python-315s-ultra-low-overhead-interpreter-profiling-mode">Python 3.15’s Ultra-Low Overhead Interpreter Profiling Mode</h1>

<p>1 July 2026</p>

<p>Python’s 3.15 JIT shows <a href="/posts/jit-on-track.html">modest speedups over the interpreter</a>. Key to that is a (to the best of my knowledge), new form of interpreter profiling that was developed for recording execution through the interpreter for JIT compilation. This form of profiling does not introduce much overhead over the interpreter as well, allowing for low-overhead JIT compilation. I wouldn’t be surprised if someone actually already came up with this before, but as far as I could find, it’s not documented anywhere.</p>

<h2 id="brief-background">Brief Background</h2>

<p>In an <a href="/posts/jit-on-track.html">earlier post</a>, I explained <em>trace recording</em> in the CPython 3.15 JIT. The key idea is that we record an instruction stream through actual program execution, until we hit some terminating condition, then we send that for JIT compilation. Naturally, this requires an instrumented/profiled interpreter.</p>

<h2 id="profiling-an-interpreter">Profiling an Interpreter</h2>

<p>There are normally two avenues of profiling an interpreter:</p>
<ol>
  <li>Have two bespoke interpreters (one for execution and one just for profiling).</li>
  <li>Implement a “profiling mode”.</li>
</ol>

<h3 id="approach-1-two-interpreters">Approach 1: Two Interpreters</h3>

<p><img src="/media/ultra-fast-tracing/interpreter-dual.svg" alt="Two interpreters, one execution, one profiling, and arrows connecting the two." /></p>

<p>The normal interpreter will have points calling into the profiling interpreter, and a way for the profiling interpreter to return into the normal interpreter. This allows switching back and forth between interpreters. This was the initial implementation of trace recording in CPython. I found it to be alright for the <a href="/posts/no-longer-sorry.html">tail-calling interpreter</a> but too slow for the computed goto interpreter (roughly a 6% slowdown on pyperformance!). I suspect the main reason was that we doubled the size of the actual interpreter implemented in C effectively for computed gotos, as that feature is function-scoped. Doubling the size of your C binary is usually not good for performance for various reasons.</p>

<h3 id="approach-2-profiling-mode">Approach 2: Profiling Mode</h3>

<p><img src="/media/ultra-fast-tracing/interpreter-mode.svg" alt="Profiling mode interpreter" /></p>

<p>The other common way to implement a profiling interpreter is to have a “profiling mode” which conditions some profiling logic on a boolean, say <code class="language-plaintext highlighter-rouge">bool profile</code>. While this minimizes the code bloat, we deemed it too disruptive to the normal interpreter and it would also slow down execution despite the branch being almost always correctly predicted by CPUs.</p>

<h2 id="dual-dispatch">Dual Dispatch</h2>

<p>To get the best out of both worlds, there is one last alternative—swap out the dispatch tables.</p>

<p><img src="/media/ultra-fast-tracing/interpreter-dual-dispatch.svg" alt="Dual dispatch interpreter, showing a normal interpreter with arrows showing how control-flow alternates between normal execution and profiling mode." /></p>

<p>Interpreters often dispatch to the next instruction by mapping the opcode (instruction ID) to a function pointer/label address. This tells the interpreter where to go for each instruction.</p>

<p>The idea instead here is to have two dispatch tables—one for normal execution, and one for the profilinng interpreter. At runtime, we just need to assign a local variable <code class="language-plaintext highlighter-rouge">dispatch_table_var</code> to decide what “mode” we are in. No branches needed! I’m quite sure I’m not the first person to do this. However, the naiive implementation of this actually gets code that is equivalent to two interpreters in one, which as I wrote above, is very slow. The key improvement then is to map all the instructions in the second table to a singular recording/profillng instruction. This instruction then does all profiling we need, and dispatches using a fixed first table to the actual next instruction in the normal interpreter for execution. You can think of this as a fan-in (to a single instruction) fan-out model. Entering profiling mode is just initializing our data structures, and interpreter wise it’s just swapping out the dispatch tables! Leaving profiling is once again, finalizing our data structures and swapping out the dispatch tables. This is the actual code in CPython 3.15:</p>

<pre><code class="language-C">#  define ENTER_TRACING() \
    DISPATCH_TABLE_VAR = TRACING_DISPATCH_TABLE;
#  define LEAVE_TRACING() \
    DISPATCH_TABLE_VAR = DISPATCH_TABLE;
</code></pre>

<p>The macros are just to handle the different tables when using comupted goto/tail calling interpreter.</p>

<h3 id="results">Results</h3>

<p>Turning off dynamic frequency scaling on my system and running a test script (found in the Appendix), these are the medians of 40 runs measuring the overhead of profiling the interpreter:</p>
<div class="language-plaintext highlighter-rouge"><div class="highlight"><pre class="highlight"><code># No profiling (just interpreter)
1.72e-06s
# Interpreter + Profiling + JIT compilation
7.47e-06s
</code></pre></div></div>
<p>This essentially means profiling the interpreter in CPython 3.15 is only at most 4.5x slower for our toy benchmark! Other tracing systems like PyPy have slowdowns in the range of <a href="https://cfbolz.de/posts/speed-of-tracing/">900x-1000x</a> ! This is of course, not a fair comparison, as PyPy is meta-tracing and thus naturally traces a lot more code than us for the same program (it has to trace the interpreter itself). However, I just put this here to give an example of how slow tracing can actually be.</p>

<h2 id="reflections">Reflections</h2>

<p>I’m very proud of what we managed to come up with for the profiling interpreter. This approach is not restricted to just trace recording. Other applications might be to introduce low-overhead profiling of an interpreter without radical rewrites, or recording an interpreter’s type profile seen during runtime, etc. Part of why I’m writing this blog post is that I believe in documenting technical knowledge and sharing it in case someone finds it useful. <strong>However, I do ask myself ocassionally: is this magical system we’ve come up with in CPython worth the complexity?</strong> I like systems that are elegant and simple, and this while elegant is definitely not that simple to reason about. I’ll pen down my thoughts on tracing more in the future..</p>

<h2 id="appendix">Appendix</h2>

<p>The benchmarking script to measure the overhead. To trigger JIT compilation, I use <code class="language-plaintext highlighter-rouge">PYTHON_JIT_RESUME_INITIAL_VALUE=1</code>:</p>

<div class="language-py highlighter-rouge"><div class="highlight"><pre class="highlight"><code><span class="k">def</span> <span class="nf">foo</span><span class="p">(</span><span class="n">x</span><span class="p">):</span>
    <span class="n">x</span> <span class="o">+</span> <span class="n">x</span>
    <span class="n">x</span> <span class="o">+</span> <span class="n">x</span>
    <span class="n">x</span> <span class="o">+</span> <span class="n">x</span>
    <span class="n">x</span> <span class="o">+</span> <span class="n">x</span>
    <span class="n">x</span> <span class="o">+</span> <span class="n">x</span>
    <span class="n">x</span> <span class="o">+</span> <span class="n">x</span>
    <span class="n">x</span> <span class="o">+</span> <span class="n">x</span>
    <span class="n">x</span> <span class="o">+</span> <span class="n">x</span>
    <span class="n">x</span> <span class="o">+</span> <span class="n">x</span>
    <span class="n">x</span> <span class="o">+</span> <span class="n">x</span>
    <span class="n">x</span> <span class="o">+</span> <span class="n">x</span>
    <span class="n">x</span> <span class="o">+</span> <span class="n">x</span>
    <span class="n">x</span> <span class="o">+</span> <span class="n">x</span>
    <span class="n">x</span> <span class="o">+</span> <span class="n">x</span>
    <span class="n">x</span> <span class="o">+</span> <span class="n">x</span>
    <span class="n">x</span> <span class="o">+</span> <span class="n">x</span>
    <span class="n">x</span> <span class="o">+</span> <span class="n">x</span>
    <span class="n">x</span> <span class="o">+</span> <span class="n">x</span>
    <span class="n">x</span> <span class="o">+</span> <span class="n">x</span>
    <span class="n">x</span> <span class="o">+</span> <span class="n">x</span>
    <span class="n">x</span> <span class="o">+</span> <span class="n">x</span>
    <span class="n">x</span> <span class="o">+</span> <span class="n">x</span>
    <span class="n">x</span> <span class="o">+</span> <span class="n">x</span>
    <span class="n">x</span> <span class="o">+</span> <span class="n">x</span>
    <span class="n">x</span> <span class="o">+</span> <span class="n">x</span>
    <span class="n">x</span> <span class="o">+</span> <span class="n">x</span>
    <span class="n">x</span> <span class="o">+</span> <span class="n">x</span>
    <span class="n">x</span> <span class="o">+</span> <span class="n">x</span>
    <span class="n">x</span> <span class="o">+</span> <span class="n">x</span>
    <span class="n">x</span> <span class="o">+</span> <span class="n">x</span>
    <span class="n">x</span> <span class="o">+</span> <span class="n">x</span>
    <span class="n">x</span> <span class="o">+</span> <span class="n">x</span>
    <span class="n">x</span> <span class="o">+</span> <span class="n">x</span>
    <span class="n">x</span> <span class="o">+</span> <span class="n">x</span>
    <span class="n">x</span> <span class="o">+</span> <span class="n">x</span>
    <span class="n">x</span> <span class="o">+</span> <span class="n">x</span>
    <span class="n">x</span> <span class="o">+</span> <span class="n">x</span>
    <span class="n">x</span> <span class="o">+</span> <span class="n">x</span>
    <span class="n">x</span> <span class="o">+</span> <span class="n">x</span>
    <span class="n">x</span> <span class="o">+</span> <span class="n">x</span>
    <span class="n">x</span> <span class="o">+</span> <span class="n">x</span>
    <span class="n">x</span> <span class="o">+</span> <span class="n">x</span>
    <span class="n">x</span> <span class="o">+</span> <span class="n">x</span>
    <span class="n">x</span> <span class="o">+</span> <span class="n">x</span>
    <span class="n">x</span> <span class="o">+</span> <span class="n">x</span>
    <span class="n">x</span> <span class="o">+</span> <span class="n">x</span>
    <span class="n">x</span> <span class="o">+</span> <span class="n">x</span>
    <span class="n">x</span> <span class="o">+</span> <span class="n">x</span>
    <span class="n">x</span> <span class="o">+</span> <span class="n">x</span>
    <span class="n">x</span> <span class="o">+</span> <span class="n">x</span>
    <span class="n">x</span> <span class="o">+</span> <span class="n">x</span>
    <span class="n">x</span> <span class="o">+</span> <span class="n">x</span>
    <span class="n">x</span> <span class="o">+</span> <span class="n">x</span>
    <span class="n">x</span> <span class="o">+</span> <span class="n">x</span>
    <span class="n">x</span> <span class="o">+</span> <span class="n">x</span>
    <span class="n">x</span> <span class="o">+</span> <span class="n">x</span>
    <span class="n">x</span> <span class="o">+</span> <span class="n">x</span>
    <span class="n">x</span> <span class="o">+</span> <span class="n">x</span>
    <span class="n">x</span> <span class="o">+</span> <span class="n">x</span>
    <span class="n">x</span> <span class="o">+</span> <span class="n">x</span>
    <span class="n">x</span> <span class="o">+</span> <span class="n">x</span>
    <span class="n">x</span> <span class="o">+</span> <span class="n">x</span>
    <span class="n">x</span> <span class="o">+</span> <span class="n">x</span>
    <span class="n">x</span> <span class="o">+</span> <span class="n">x</span>
    <span class="n">x</span> <span class="o">+</span> <span class="n">x</span>
    <span class="n">x</span> <span class="o">+</span> <span class="n">x</span>
    <span class="n">x</span> <span class="o">+</span> <span class="n">x</span>
    <span class="n">x</span> <span class="o">+</span> <span class="n">x</span>
    <span class="n">x</span> <span class="o">+</span> <span class="n">x</span>
    <span class="n">x</span> <span class="o">+</span> <span class="n">x</span>
    <span class="n">x</span> <span class="o">+</span> <span class="n">x</span>
    <span class="n">x</span> <span class="o">+</span> <span class="n">x</span>
    <span class="n">x</span> <span class="o">+</span> <span class="n">x</span>
    <span class="n">x</span> <span class="o">+</span> <span class="n">x</span>
    <span class="n">x</span> <span class="o">+</span> <span class="n">x</span>
    <span class="n">x</span> <span class="o">+</span> <span class="n">x</span>
    <span class="n">x</span> <span class="o">+</span> <span class="n">x</span>
    <span class="n">x</span> <span class="o">+</span> <span class="n">x</span>
    <span class="n">x</span> <span class="o">+</span> <span class="n">x</span>
    <span class="n">x</span> <span class="o">+</span> <span class="n">x</span>
    <span class="n">x</span> <span class="o">+</span> <span class="n">x</span>
    <span class="n">x</span> <span class="o">+</span> <span class="n">x</span>
    <span class="n">x</span> <span class="o">+</span> <span class="n">x</span>
    <span class="n">x</span> <span class="o">+</span> <span class="n">x</span>
    <span class="n">x</span> <span class="o">+</span> <span class="n">x</span>
    <span class="n">x</span> <span class="o">+</span> <span class="n">x</span>
    <span class="n">x</span> <span class="o">+</span> <span class="n">x</span>
    <span class="n">x</span> <span class="o">+</span> <span class="n">x</span>
    <span class="n">x</span> <span class="o">+</span> <span class="n">x</span>
    <span class="n">x</span> <span class="o">+</span> <span class="n">x</span>
    <span class="n">x</span> <span class="o">+</span> <span class="n">x</span>
    <span class="n">x</span> <span class="o">+</span> <span class="n">x</span>
    <span class="n">x</span> <span class="o">+</span> <span class="n">x</span>
    <span class="n">x</span> <span class="o">+</span> <span class="n">x</span>
    <span class="n">x</span> <span class="o">+</span> <span class="n">x</span>
    <span class="n">x</span> <span class="o">+</span> <span class="n">x</span>
    <span class="n">x</span> <span class="o">+</span> <span class="n">x</span>
    <span class="n">x</span> <span class="o">+</span> <span class="n">x</span>
    <span class="n">x</span> <span class="o">+</span> <span class="n">x</span>
    <span class="n">x</span> <span class="o">+</span> <span class="n">x</span>
    <span class="n">x</span> <span class="o">+</span> <span class="n">x</span>
    <span class="n">x</span> <span class="o">+</span> <span class="n">x</span>
    <span class="n">x</span> <span class="o">+</span> <span class="n">x</span>
    <span class="n">x</span> <span class="o">+</span> <span class="n">x</span>
    <span class="n">x</span> <span class="o">+</span> <span class="n">x</span>
    <span class="n">x</span> <span class="o">+</span> <span class="n">x</span>
    <span class="n">x</span> <span class="o">+</span> <span class="n">x</span>
    <span class="n">x</span> <span class="o">+</span> <span class="n">x</span>
    <span class="n">x</span> <span class="o">+</span> <span class="n">x</span>
    <span class="n">x</span> <span class="o">+</span> <span class="n">x</span>
    <span class="n">x</span> <span class="o">+</span> <span class="n">x</span>
    <span class="n">x</span> <span class="o">+</span> <span class="n">x</span>
    <span class="n">x</span> <span class="o">+</span> <span class="n">x</span>
    <span class="n">x</span> <span class="o">+</span> <span class="n">x</span>
    <span class="n">x</span> <span class="o">+</span> <span class="n">x</span>
    <span class="n">x</span> <span class="o">+</span> <span class="n">x</span>
    <span class="n">x</span> <span class="o">+</span> <span class="n">x</span>
    <span class="n">x</span> <span class="o">+</span> <span class="n">x</span>
    <span class="n">x</span> <span class="o">+</span> <span class="n">x</span>
    <span class="n">x</span> <span class="o">+</span> <span class="n">x</span>
    <span class="n">x</span> <span class="o">+</span> <span class="n">x</span>
    <span class="n">x</span> <span class="o">+</span> <span class="n">x</span>
    <span class="n">x</span> <span class="o">+</span> <span class="n">x</span>
    <span class="n">x</span> <span class="o">+</span> <span class="n">x</span>
    <span class="n">x</span> <span class="o">+</span> <span class="n">x</span>
    <span class="n">x</span> <span class="o">+</span> <span class="n">x</span>
    <span class="n">x</span> <span class="o">+</span> <span class="n">x</span>
    <span class="n">x</span> <span class="o">+</span> <span class="n">x</span>
    <span class="n">x</span> <span class="o">+</span> <span class="n">x</span>
    <span class="n">x</span> <span class="o">+</span> <span class="n">x</span>
    <span class="n">x</span> <span class="o">+</span> <span class="n">x</span>
    <span class="n">x</span> <span class="o">+</span> <span class="n">x</span>
    <span class="n">x</span> <span class="o">+</span> <span class="n">x</span>
    <span class="n">x</span> <span class="o">+</span> <span class="n">x</span>
    <span class="n">x</span> <span class="o">+</span> <span class="n">x</span>
    <span class="n">x</span> <span class="o">+</span> <span class="n">x</span>
    <span class="n">x</span> <span class="o">+</span> <span class="n">x</span>
    <span class="n">x</span> <span class="o">+</span> <span class="n">x</span>
    <span class="n">x</span> <span class="o">+</span> <span class="n">x</span>
    <span class="n">x</span> <span class="o">+</span> <span class="n">x</span>
    <span class="n">x</span> <span class="o">+</span> <span class="n">x</span>
    <span class="n">x</span> <span class="o">+</span> <span class="n">x</span>
    <span class="n">x</span> <span class="o">+</span> <span class="n">x</span>
    <span class="n">x</span> <span class="o">+</span> <span class="n">x</span>
    <span class="n">x</span> <span class="o">+</span> <span class="n">x</span>
    <span class="n">x</span> <span class="o">+</span> <span class="n">x</span>
    <span class="n">x</span> <span class="o">+</span> <span class="n">x</span>
    <span class="n">x</span> <span class="o">+</span> <span class="n">x</span>


<span class="n">foo</span><span class="p">(</span><span class="mi">1</span><span class="p">)</span>
<span class="kn">import</span> <span class="nn">sys</span>
<span class="kn">import</span> <span class="nn">time</span>
<span class="n">start</span> <span class="o">=</span> <span class="n">time</span><span class="p">.</span><span class="n">time</span><span class="p">()</span>
<span class="n">foo</span><span class="p">(</span><span class="mi">1</span><span class="p">)</span>
<span class="n">end</span> <span class="o">=</span> <span class="n">time</span><span class="p">.</span><span class="n">time</span><span class="p">()</span>
<span class="k">print</span><span class="p">(</span><span class="n">end</span> <span class="o">-</span> <span class="n">start</span><span class="p">)</span>
<span class="c1"># sys._dump_tracelets("hello.gvz")
</span></code></pre></div></div>]]></content><author><name>Ken Jin</name></author><summary type="html"><![CDATA[Python 3.15’s Ultra-Low Overhead Interpreter Profiling Mode]]></summary></entry><entry><title type="html">Python 3.15’s JIT is now back on track</title><link href="https://fidget-spinner.github.io/posts/jit-on-track.html" rel="alternate" type="text/html" title="Python 3.15’s JIT is now back on track" /><published>2026-03-17T00:00:00+00:00</published><updated>2026-03-17T00:00:00+00:00</updated><id>https://fidget-spinner.github.io/posts/jit-on-track</id><content type="html" xml:base="https://fidget-spinner.github.io/posts/jit-on-track.html"><![CDATA[<h1 id="python-315s-jit-is-now-back-on-track">Python 3.15’s JIT is now back on track</h1>

<p>17 Mar 2026</p>

<p><img src="/media/jit-on-track/brrr-20260317.png" alt="JIT performance as of 17 March (PST). Lower is better versus interpreter" />
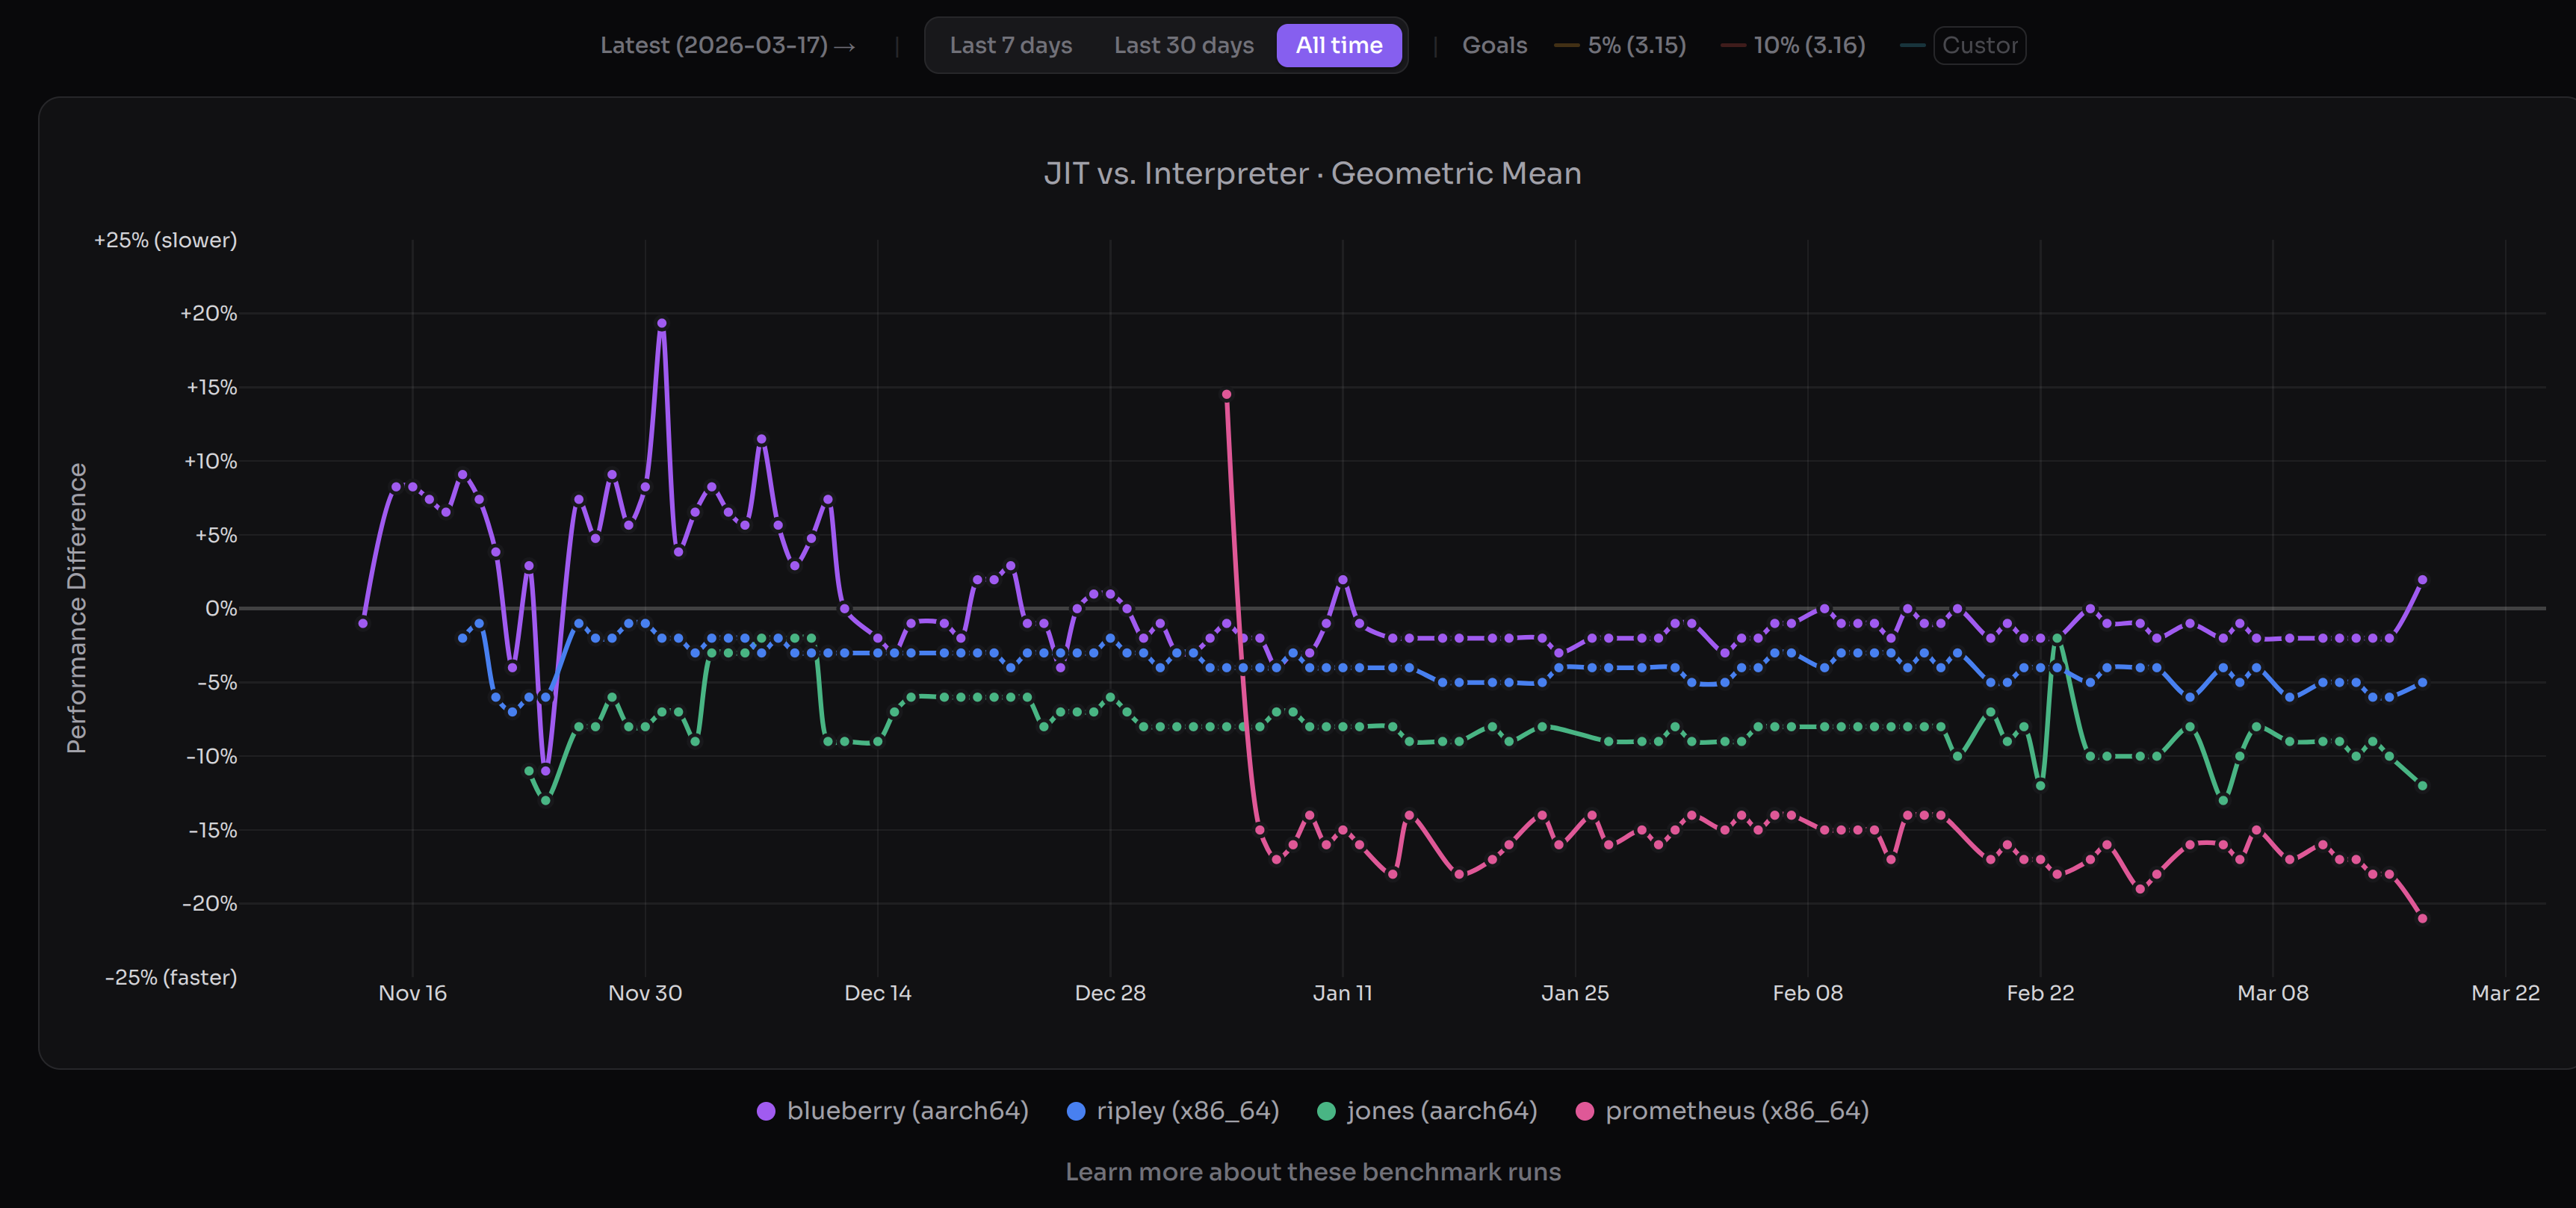
(JIT performance as of 17 March (PST). Lower is better versus interpreter. Image credits to https://doesjitgobrrr.com/).</p>

<p>Great news—we’ve hit our (very modest) performance goals for the CPython JIT over a year early for macOS AArch64, and a few months early for x86_64 Linux. The 3.15 alpha JIT is about <strong>11-12%</strong> faster on macOS AArch64 than the tail calling interpreter, and <strong>5-6%</strong> faster than the standard interpreter on x86_64 Linux. These <a href="https://doesjitgobrrr.com/run/2026-03-17">numbers</a> are geometric means and are preliminary. The actual range is something like a <strong>20% slowdown to over 100% speedup</strong> (ignoring the <code class="language-plaintext highlighter-rouge">unpack_sequence</code> microbenchmark). We don’t have proper free-threading support yet, but we’re aiming for that in 3.15/3.16. The JIT is now back on track.</p>

<p><strong>I cannot overstate how tough this was</strong>. There was a point where I was seriously wondering if the JIT project would ever produce meaningful speedups. To recap, the original CPython JIT had practically no speedups: 8 months ago I posted a <a href="/posts/jit-reflections.html">JIT reflections article</a> on how the original CPython JIT in 3.13 and 3.14 was often slower than the interpreter. That was also around the time where the Faster CPython team lost funding by its main sponsor. I’m a volunteer so this didn’t affect me, but more importantly it did affect my friends working there, and at a point of time it seemed the JIT’s future was uncertain.</p>

<p>So what changed from 3.13 and 3.14? I’m not going to give some heroic tale of how we rescued the JIT from the jaws of failure through our acumen. I honestly attribute a lot of our current success to luck—right time, right place, right people, right bets. I seriously don’t think this would’ve been possible if a single one of the core JIT contributors: Savannah Ostrowski, Mark Shannon, Diego Russo, Brandt Bucher, and me were not in the picture. To not exclude the other active JIT contributors, I will also name a few more people: Hai Zhu, Zheaoli, Tomas Roun, Reiden Ong, Donghee Na, and I am probably missing a few more.</p>

<p>I’m going to cover a lesser talked about part of a JIT: the people, and a bit of luck. If you want the technical details of how we did it, it’s <a href="/posts/faster-jit-plan.html">here</a></p>

<h2 id="part-1-a-community-led-jit">Part 1: A community-led JIT</h2>

<p>The Faster CPython team lost its main sponsor in 2025. I immediately <a href="https://discuss.python.org/t/community-stewardship-of-faster-cpython/92153">raised the idea of community stewardship</a>. At the time, I was pretty uncertain this would work. JIT projects are not known to be good for new contributors. It historically requires a lot of prior expertise.</p>

<p>At the CPython core sprint in Cambridge, the JIT core team met, and we <a href="/posts/faster-jit-plan.html">wrote a plan</a> for a 5% faster JIT by 3.15 and a 10% faster JIT by 3.16, with free-threading support.
A side note, which was less headline grabbing, but vital to the health of the project: was to <strong>decrease the bus factor</strong>. We wanted 2 active maintainers in all 3 stages of the JIT; frontend (region selector), middle-end (optimizer), backend (code generator).</p>

<p>Previously, the JIT only had 2 active recurrent contributors middle-end. Today, the JIT has 4 active recurrent contributors to the middle-end, and I would consider the 2 non-core developers (Hai Zhu and Reiden) capable and valued members.</p>

<p>What worked in attracting people were the usual software engineering practices: breaking complex problems down into manageable parts. Brandt started this earlier in 3.14, where he opened multiple <a href="https://github.com/python/cpython/issues/131798">mega-issues</a> that split optimizing the JIT into simple tasks. E.g. we would say “try optimizing a single instruction in the JIT”. I took Brandt’s idea and did this for 3.15. Luckily, I had an easier job as my issue involved converting the interpreter instructions to an easily optimizeable form. To encourage new contributors, I also laid out <a href="https://github.com/python/cpython/issues/134584">very detailed instructions</a> that were immediately actionable. I also clearly demarcated units of work. I suspect that did help, as we have 11 contributors (including me) working on that issue, converting nearly the whole of the interpreter to something more JIT-optimizer friendly. The core was that the JIT could be broken down from an opaque blob to something that a C programmer with no JIT experience could contribute to.</p>

<p>Other things that worked: encouraging people, celebrating achievements big or small. Every JIT PR had a clear outcome, which I suspect gave people a sense of direction.</p>

<p>The community optimization efforts paid off. The JIT went from 1% faster on x86_64 Linux to 3-4% faster (see the blue line below) over that time period:</p>

<p><img src="/media/jit-on-track/refcount-jit-vs-interpreter.png" alt="JIT performance vs interpreter during community optimization effort" />
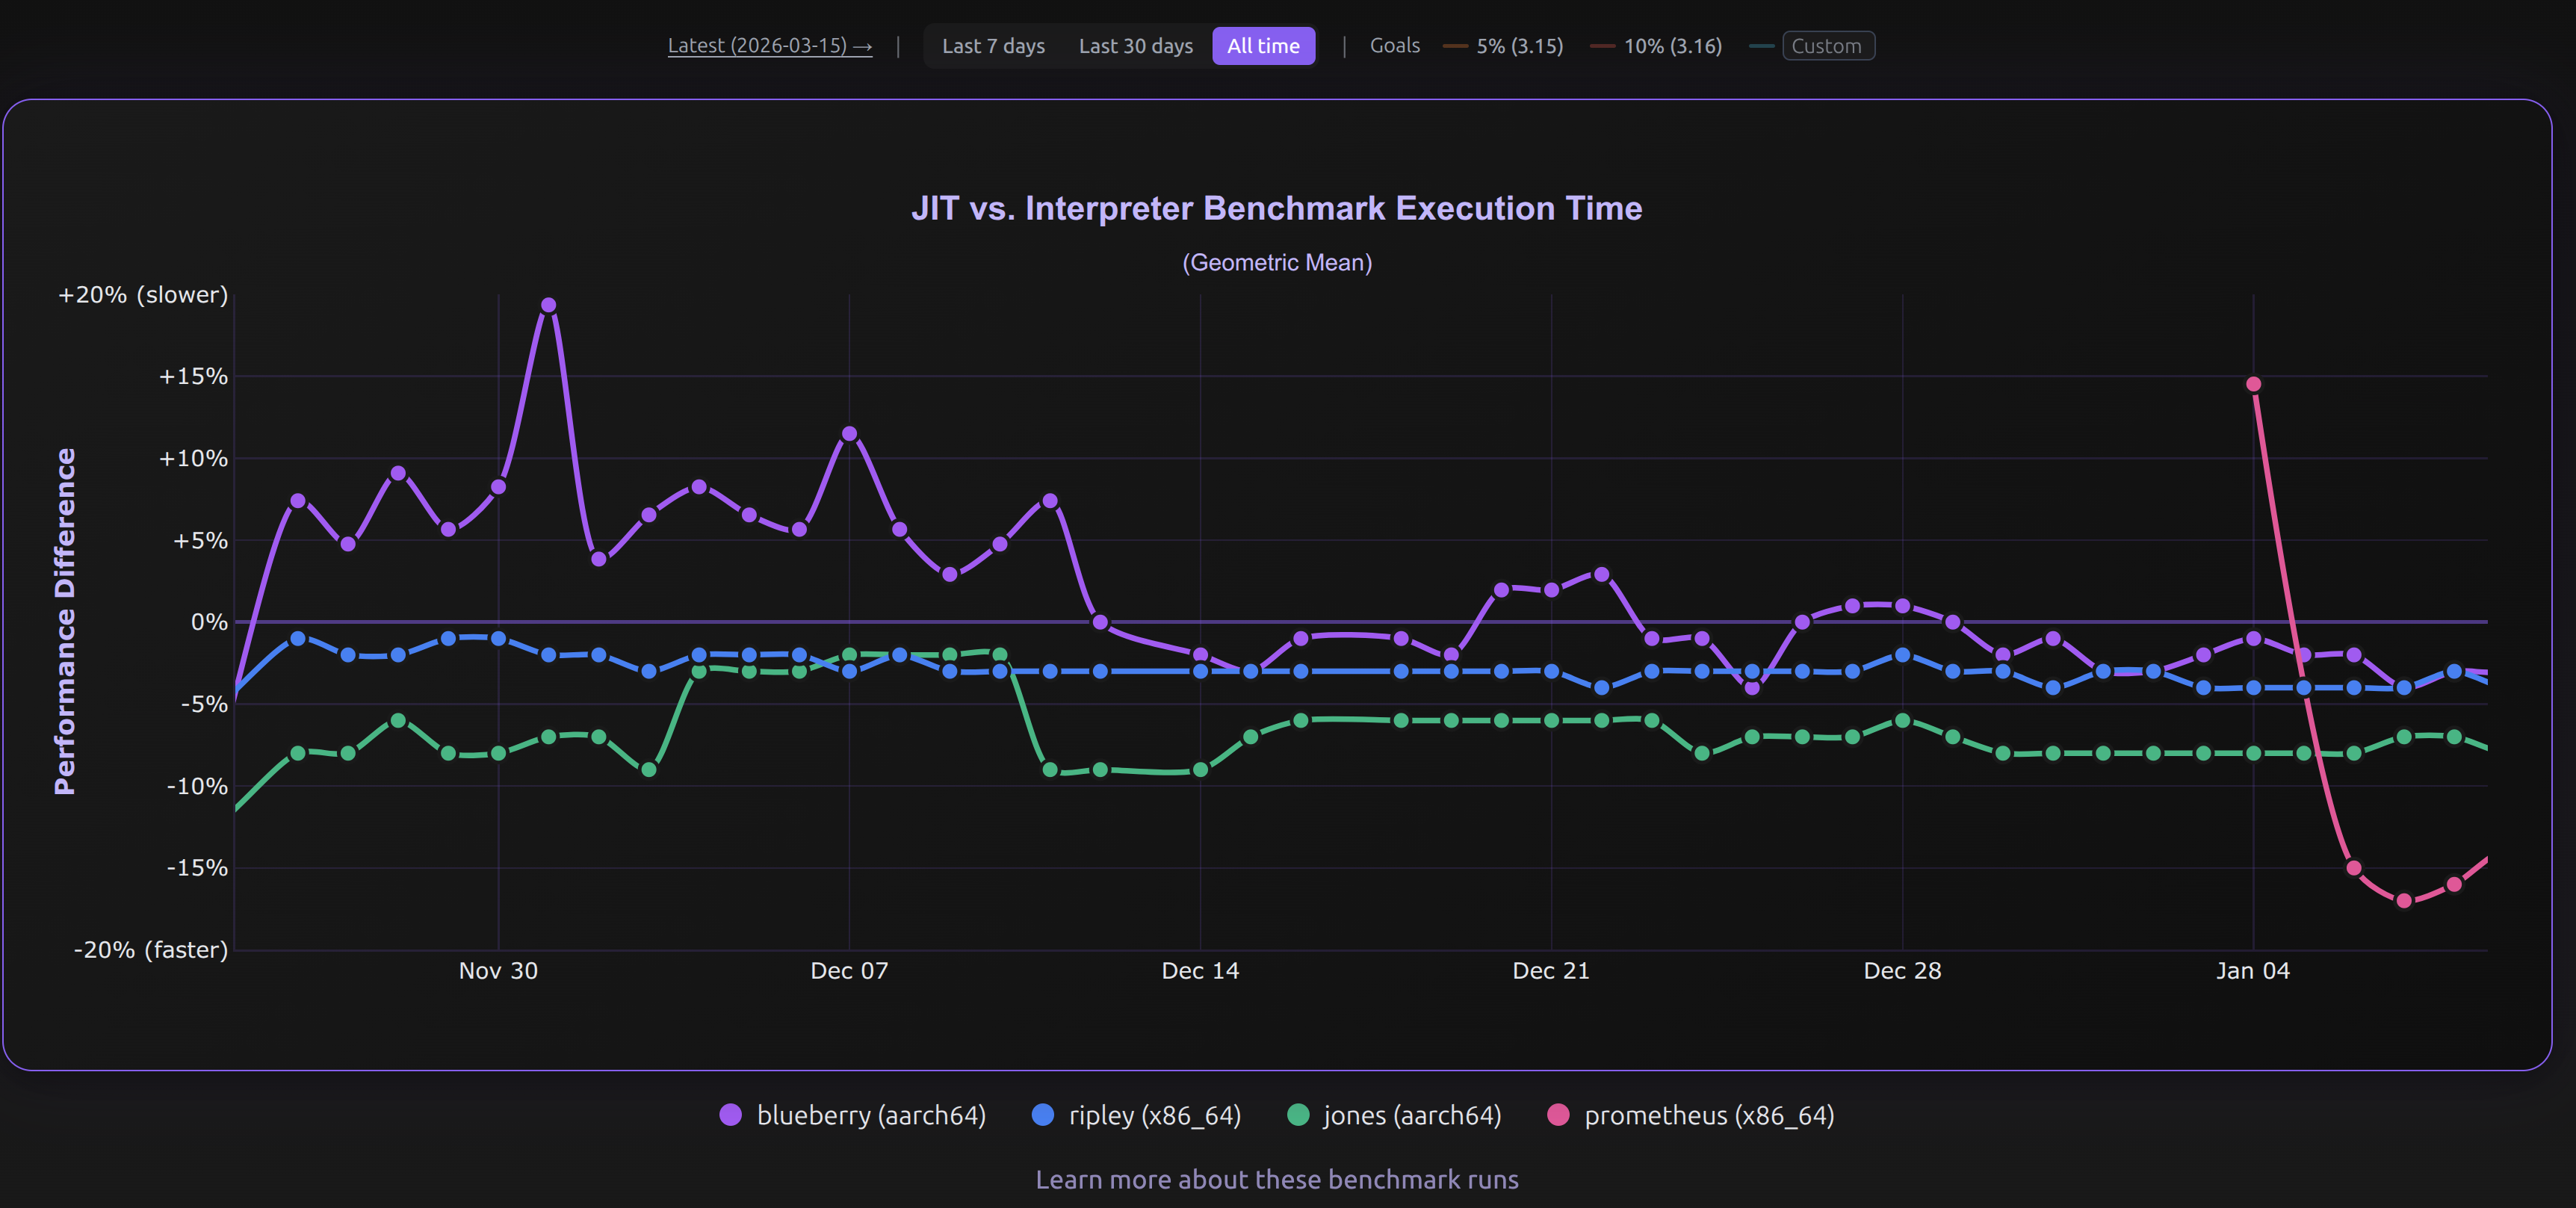
(Image credits to https://doesjitgobrrr.com/).</p>

<h2 id="part-2-lucky-bets">Part 2: Lucky bets</h2>

<h3 id="trace-recording">Trace recording</h3>
<p>Again, I attribute a lot of this to luck, but during the CPython core sprints in Cambridge, Brandt nerd-sniped me to rewrite the JIT frontend to a tracing one. I initially didn’t like the idea, but as a friendly form of spite-driven-development, I thought I’d rewrite it just to prove to him it didn’t work.</p>

<p>The initial prototype worked in 3 days, however it took a month to get it JITting properly without failing the test suite. The initial results were dismal—about 6% slower on x86_64 Linux. I was about to ditch the idea, until a lucky accident happened: I misinterpertered a suggestion given by Mark.</p>

<p>Mark had suggested earlier to thread the dispatch table through the interpreter, thus having two dispatch tables in the interpreter (one normal interpreter, and one for tracing). Mark suggested we should have the tracing table be tracing versions of normal instructions. However, I misunderstood and came up with an even more extreme version: instead of tracing versions of normal instructions, I had only one instruction responsible for tracing, and all instructions in the second table point to that. Yes I know this part is confusing, I’ll hopefully try to explain better one day. This turned out to be a really really good choice. I found that the initial dual table approach was so much slower due to a doubling of the size of the interpreter, causing huge compiled code bloat, and naturally a slowdown. By using only a single instruction and two tables, we only increase the interpreter by a size of 1 instruction, and also keep the base interpreter ultra fast. I affectionally call this mechanism dual dispatch.</p>

<p>There’s a lot more that went into the design of the trace recording interpreter. I’m tooting my own horn here, but I truly think it’s a mini work of art. It took me 1 week to iterate on the interpreter until it was overall faster. It went from 6% slower to roughly no speedup after using dual dispatch. After that, I stamped out a bunch of slow edge cases in the tracing interpreter to eventually make it 1.x% faster. Tracing the interpreter itself is only 3-5x slower by my own estimations than the specializing interpreter. Key to this is that it respects all normal behavior of the specializing interpreter and mostly doesn’t intefere with it.</p>

<p>Just to give you an idea of how much trace recording mattered: it increased the JIT code coverage by 50%. This means all future optimizations would likely have been around 50% less effective (assuming all code executes the same, which of course isn’t true, just bear with me please :).</p>

<p>So I have to thank Brandt and Mark for leading me to stumble upon such a nice solution.</p>

<h3 id="reference-count-elimination">Reference count elimination</h3>

<p>The other lucky bet we made early on was to try reference count elimination. This, again, was work originally by Matt Page done in CPython bytecode optimizer (more details in previous blog post on optimization). I noticed that there was still a branch left in the JITted code per reference count decrement even with the bytecode optimizer work. I thought: “why not try eliminating the branch”, and had no clue how much it would help. It turns out a single branch is actually quite expensive and these add up over time. Especially if it’s &gt;=1 branch for every single Python instruction!</p>

<p>The other lucky part is how easy this was to parallelize and how great it was a tool to teach people about the interpreter and JIT. This was the main optimization that we directed people to work on in the Python 3.15 JIT. Although it was a mostly manual refactoring process, it taught people the key parts they needed to learn about the JIT without overhwhelming them.</p>

<h2 id="part-3-a-great-team">Part 3: A great team</h2>

<p>We have a great infrastructure team. I say this partly in jest, because it’s one person. In reality, our “team” is currently 4 machines running in Savannah’s closet. Nevertheless Savannah has done the work equivalent of an entire infrastructure team for the JIT. The JIT could not have progressed so quickly if we had nothing to report our performance numbers. Daily JIT runs have been a game changer in the feedback loop. It helped us catch <a href="https://github.com/python/cpython/pull/143268">regressions</a> in JIT performance, and lets us know our optimizations actually work.</p>

<p>Mark is technically excellent, and I think he knows the Internet gives him too much praise already so I’m not going to say anything more here :).</p>

<p>Diego is also great. He’s responsible for the JIT on ARM hardware, and also has recently started work on making the JIT friendly to profilers. I cannot overstate how hard of a problem this is.</p>

<p>Brandt laid the original foundation for our machine code backend, without which we’d have new contributors writing assembler, which probably would’ve put more people off.</p>

<h2 id="part-4-talking-to-people">Part 4: Talking to people</h2>

<p>I also want to encourage the idea of talking to people and sharing ideas.</p>

<p>A shoutout to CF Bolz-Tereick, who taught me a lot about PyPy. I spent a few months looking at PyPy’s source code, and I believe this made me a better JIT developer overall. CF was very helpful when I needed help.</p>

<p>I’m also part of a friendly compiler chat with Max Bernstein, without which I’d likely have lost motivation for this a long time ago. Max is a prolific writer, and a friendly compiler person.</p>

<p>Ideas don’t exist in a silo. I suspect I became better at writing JITs thanks to hanging out with a bunch of compiler people for some time. At the very least, looking at PyPy has broadened my view!</p>

<h1 id="conclusion">Conclusion</h1>

<p>People are important, and with some luck, <a href="https://doesjitgobrrr.com/">JIT go brrr</a>.</p>]]></content><author><name>Ken Jin</name></author><summary type="html"><![CDATA[Python 3.15’s JIT is now back on track]]></summary></entry><entry><title type="html">Python 3.15’s interpreter for Windows x86-64 should hopefully be 15% faster</title><link href="https://fidget-spinner.github.io/posts/no-longer-sorry.html" rel="alternate" type="text/html" title="Python 3.15’s interpreter for Windows x86-64 should hopefully be 15% faster" /><published>2025-12-24T00:00:00+00:00</published><updated>2025-12-24T00:00:00+00:00</updated><id>https://fidget-spinner.github.io/posts/no-longer-sorry</id><content type="html" xml:base="https://fidget-spinner.github.io/posts/no-longer-sorry.html"><![CDATA[<h1 id="python-315s-interpreter-for-windows-x86-64-should-hopefully-be-15-faster">Python 3.15’s interpreter for Windows x86-64 should hopefully be 15% faster</h1>

<p>24 December 2025</p>

<p>Some time ago I posted an <a href="/posts/apology-tail-call.html">apology piece</a>
for Python’s tail calling results. I apologized for communicating performance
results without noticing a compiler bug had occured.</p>

<p>I can proudly say today that I am partially retracting that apology, but
only for two platforms—macOS AArch64 (XCode Clang) and Windows x86-64 (MSVC).</p>

<p>In our own experiments, the tail calling interpreter for CPython
was found to beat the computed
goto interpreter by 5% on pyperformance on AArch64 macOS using XCode Clang,
and roughly 15% on pyperformance on Windows on an experimental internal
version of MSVC. The Windows build is against a switch-case interpreter, but
this in theory shouldn’t matter too much, more on that in the next section.</p>

<p>This is of course, a <strong>hopefully accurate</strong> result. I tried to be more diligent
here, but I am of course not infallible. However, I have found that sharing early and making a fool of myself often works well, as it has led to people catching bugs in my code, so I shall continue doing so :).</p>

<p>Also this assumes the change doesn’t get reverted later in Python 3.15’s 
development cycle.</p>

<h2 id="brief-background-on-interpreters">Brief background on interpreters</h2>
<p>Just a recap. There are two popular current ways of writing C-based
interpreters.</p>

<p>Switch-cases:</p>

<pre><code class="language-C">switch (opcode) {
    case INST_1: ...
    case INST_2: ...
}
</code></pre>

<p>Where we just switch-case to the correct instruction handler.</p>

<p>And the other popular way is a
GCC/Clang extension called labels-as-values/computed gotos.</p>

<pre><code class="language-C">goto *dispatch_table[opcode];
INST_1: ...
INST_2: ...
</code></pre>

<p>Which is basically the same idea, but to instead jump to the address of the
next label. Traditionally, the key optimization here is that it needs
only one jump to go to the next instruction, while in the switch-case
interpreter, a naiive compiler would need two jumps.</p>

<p>With modern compilers however, the benefits of the computed gotos is a lot less,
mainly because modern compilers have gotten better and modern hardware
has also gotten better. In Nelson Elhage’s
<a href="https://blog.nelhage.com/post/cpython-tail-call/">excellent investigation</a>
on the next kind of interpreter,
the speedup of computed gotos over switch case on modern Clang was
only in the low single digits on pyperformance.</p>

<p>A 3rd way that was suggested decades ago, but not really entirely feasible
is call/tail-call threaded interpreters. In this scheme, each bytecode
handler is its own function, and we tail-call from one handler to the next
in the instruction stream:</p>

<div class="language-plaintext highlighter-rouge"><div class="highlight"><pre class="highlight"><code>return dispatch_table[opcode];

PyObject *INST_1(...) {

}

PyObject *INST_2(...) {
}
</code></pre></div></div>

<p>This wasn’t too feasible in C for one main reason—tail call optimization
was merely an <em>optimization</em>. It’s something the C compiler might do, or
might not do. This means if you’re unlucky and the C compiler chooses not
to perform the tail call, your interpreter might stack overflow!</p>

<p>Some time ago, Clang introduced <code class="language-plaintext highlighter-rouge">__attribute__((musttail))</code>, which allowed
for mandating that a call <em>must</em> be tail-called. Otherwise, the compilation
will fail. To my knowledge, the first time this was popularized for use
in a mainstream interpreter was in
<a href="https://blog.reverberate.org/2021/04/21/musttail-efficient-interpreters.html">Josh Haberman’s Protobuf blog post</a>.</p>

<p>Later on, Haoran Xu noticed that the GHC calling convention combined with
tail calls produced efficient code. They used this for their baseline
JIT in a paper and termed the technique
<a href="https://dl.acm.org/doi/abs/10.1145/3485513">Copy-and-Patch</a>.</p>

<h2 id="so-where-are-we-now">So where are we now?</h2>

<p>After using a fixed XCode Clang, our performance numbers on CPython
3.14/3.15 suggest that the tail calling interpreter does provide a
modest speedup over computed gotos. Around the 5% geomean range on
pyperformance.</p>

<p>To my understanding, <code class="language-plaintext highlighter-rouge">uv</code> already ships Python 3.14 on macOS with tail calling,
which might be responsible for some of the speedups you see on there.
We’re planning to ship the official 3.15 macOS binaries on <code class="language-plaintext highlighter-rouge">python.org</code> with
tail calling as well.</p>

<p>However, you’re not here for that. The title of this blog post
is clearly about MSVC Windows x86-64. So what about that?</p>

<h2 id="tail-calling-for-windows">Tail-calling for Windows</h2>

<blockquote>
  <p>[!CAUTION]
The features for MSVC discussed below are to my knowledge, experimental.
They are not guaranteed to always be around unless the MSVC team decide to keep them. Use at your own risk!</p>
</blockquote>

<p>These are the preliminary pyperformance results
for CPython on MSVC with tail-calling vs 
switch-case. Any number above 1.00x is a speedup
(e.g. <code class="language-plaintext highlighter-rouge">1.01x == 1% speedup</code>), anything below 1.00x is a slowdown.
The speedup is a geomtric mean of around 15-16%, with a
range of ~60% slowdown (one or two outliers) to 78% speedup.
However, the key thing is that the vast majority of benchmaarks sped up!</p>

<p><img src="/media/TC-PGO-Ex3-vs-PGO.svg" alt="Tailcall results" /></p>

<p><em>Chart credits to Michael Droettboom</em></p>

<blockquote>
  <p>[!WARNING]
These results are on an experimental internal MSVC compiler, public results below.</p>
</blockquote>

<p>To verify this and make sure I wasn’t wrong yet again, I checked the results
on my machine with Visual Studio 2026. These are the results from
<a href="https://github.com/python/cpython/issues/139922">this issue</a>.</p>

<div class="language-plaintext highlighter-rouge"><div class="highlight"><pre class="highlight"><code>Mean +- std dev: [spectralnorm_tc_no] 146 ms +- 1 ms -&gt; [spectralnorm_tc] 98.3 ms +- 1.1 ms: 1.48x faster
Mean +- std dev: [nbody_tc_no] 145 ms +- 2 ms -&gt; [nbody_tc] 107 ms +- 2 ms: 1.35x faster
Mean +- std dev: [bm_django_template_tc_no] 26.9 ms +- 0.5 ms -&gt; [bm_django_template_tc] 22.8 ms +- 0.4 ms: 1.18x faster
Mean +- std dev: [xdsl_tc_no] 64.2 ms +- 1.6 ms -&gt; [xdsl_tc] 56.1 ms +- 1.5 ms: 1.14x faster
</code></pre></div></div>

<p>So yeah, the speedups are real! For a large-ish library like xDSL, we see
a 14% speedup, while for smaller microbenchmarks like nbody and spectralnorm,
the speedups are greater.</p>

<p>Thanks to Chris Eibl and Brandt Bucher, we managed to get the
<a href="https://github.com/python/cpython/pull/143068">PR for this</a>
on MSVC over the finish line. I also want to sincerely thank the MSVC team. I can’t say this enough: they have been a joy to work with and
I’m very impressed by what they’ve done, and I want to congratulate them
on releasing Visual Studio 2026. This feature was made possible thanks
to new features in Visual Studio 2026, and would not have been achievable
with prior Visual Studio versions.</p>

<p>This is now listed in the What’s New for 3.15 notes:</p>
<blockquote>
  <p>Builds using Visual Studio 2026 (MSVC 18) may now use the new tail-calling interpreter. Results on Visual Studio 18.1.1 report between 15-20% speedup on the geometric mean of pyperformance on Windows x86-64 over the switch-case interpreter on an AMD Ryzen 7 5800X. We have observed speedups ranging from 14% for large pure-Python libraries to 40% for long-running small pure-Python scripts on Windows. This was made possible by a new feature introduced in MSVC 18. (Contributed by Chris Eibl, Ken Jin, and Brandt Bucher in gh-143068. Special thanks to the MSVC team including Hulon Jenkins.)</p>
</blockquote>

<p>This is the <a href="https://learn.microsoft.com/en-us/cpp/cpp/attributes?view=msvc-170#msvcmusttail">documentation for [[msvc::musttail]]</a>.</p>

<h3 id="where-exactly-do-the-speedups-come-from">Where exactly do the speedups come from?</h3>

<p>I used to believe the the tail calling interpreters get their speedup
from better register use. While I still believe that now, I suspect that is
not the main reason for speedups in CPython.</p>

<p>My main guess now is that
<strong>tail calling resets compiler heuristics to sane levels, so that compilers can do their jobs</strong>.</p>

<p>Let me show an example, at the time of writing, CPython 3.15’s interpreter loop
is around <a href="https://github.com/python/cpython/blob/main/Python/generated_cases.c.h">12k</a> lines of C code. That’s 12k lines in a <strong>single</strong> function
for the switch-case and computed goto interpreter.</p>

<p>This has caused many issues for compilers in the past, too many to list in fact.
I have a EuroPython 2025 <a href="https://youtu.be/pUj32SF94Zw?si=aXHa-70nt8EeN9nX">talk</a> about this. In short, this overly large function
breaks a lot of compiler heuristics.</p>

<p>One of the most beneficial optimisations is inlining. In the past, we’ve found
that compilers sometimes straight up
<a href="https://github.com/python/cpython/issues/121263">refuse</a> to inline even the 
simplest of functions in that 12k loc eval loop. I want to stress that this
is not the fault of the compiler. It’s actually doing the correct
thing—you usually don’t want to increase the code size of something already 
super large. Unfortunately, this does’t bode well for our interpreter.</p>

<p>You might say just write the interpreter in assembly!
However, the whole point of this exercise is to not do that.</p>

<p>Ok enough talk, let’s take a look at the code now. Taking a real
example, we examine <code class="language-plaintext highlighter-rouge">BINARY_OP_ADD_INT</code> which adds two Python integers.
Cleaning up the code so it’s readable, things look like this:</p>

<pre><code class="language-C">TARGET(BINARY_OP_ADD_INT) {
    // Increment the instruction pointer.
    _Py_CODEUNIT* const this_instr = next_instr;
    frame-&gt;instr_ptr = next_instr;
    next_instr += 6;
    _PyStackRef right = stack_pointer[-1];

    // Check that LHS is an int.
    PyObject *value_o = PyStackRef_AsPyObjectBorrow(left);
    if (!_PyLong_CheckExactAndCompact(value_o)) {
        JUMP_TO_PREDICTED(BINARY_OP);
    }

    // Check that RHS is an int.
    // ... (same code as above for LHS)

    // Add them together.
    PyObject *left_o = PyStackRef_AsPyObjectBorrow(left);
    PyObject *right_o = PyStackRef_AsPyObjectBorrow(right);
    res = _PyCompactLong_Add((PyLongObject *)left_o, (PyLongObject *)right_o);

    // If the addition fails, fall back to the generic instruction.
    if (PyStackRef_IsNull(res)) {
        JUMP_TO_PREDICTED(BINARY_OP);
    }

    // Close the references.
    PyStackRef_CLOSE_SPECIALIZED(left, _PyLong_ExactDealloc);
    PyStackRef_CLOSE_SPECIALIZED(right, _PyLong_ExactDealloc);

    // Write to the stack, and dispatch.
    stack_pointer[-2] = res;
    stack_pointer += -1;
    DISPATCH();
}
</code></pre>

<p>Seems simple enough, let’s take a look at the assembly for switch-case on
VS 2026. Note again, this is a non-PGO build for easy source information,
PGO generally makes some of these problems go away, but not all of them:</p>

<pre><code class="language-C">                if (!_PyLong_CheckExactAndCompact(value_o)) {
00007FFC4DE24DCE  mov         rcx,rbx  
00007FFC4DE24DD1  mov         qword ptr [rsp+58h],rax  
00007FFC4DE24DD6  call        _PyLong_CheckExactAndCompact (07FFC4DE227F0h)  
00007FFC4DE24DDB  test        eax,eax  
00007FFC4DE24DDD  je          _PyEval_EvalFrameDefault+10EFh (07FFC4DE258FFh)
...
                res = _PyCompactLong_Add((PyLongObject *)left_o, (PyLongObject *)right_o);
00007FFC4DE24DFF  mov         rdx,rbx  
00007FFC4DE24E02  mov         rcx,r15  
00007FFC4DE24E05  call        _PyCompactLong_Add (07FFC4DD34150h)  
00007FFC4DE24E0A  mov         rbx,rax  
...
                PyStackRef_CLOSE_SPECIALIZED(value, _PyLong_ExactDealloc);
00007FFC4DE24E17  lea         rdx,[_PyLong_ExactDealloc (07FFC4DD33BD0h)]  
00007FFC4DE24E1E  mov         rcx,rsi  
00007FFC4DE24E21  call        PyStackRef_CLOSE_SPECIALIZED (07FFC4DE222A0h) 
</code></pre>

<p>Huh… all our functions were not inlined. Surely that must’ve mean they were
too big or something right? Let’s look at <code class="language-plaintext highlighter-rouge">PyStackReF_CLOSE_SPECIALIZED</code>:</p>

<pre><code class="language-C">static inline void
PyStackRef_CLOSE_SPECIALIZED(_PyStackRef ref, destructor destruct)
{
    assert(!PyStackRef_IsNull(ref));
    if (PyStackRef_RefcountOnObject(ref)) {
        Py_DECREF_MORTAL_SPECIALIZED(BITS_TO_PTR(ref), destruct);
    }
}
</code></pre>

<p>That looks … inlineable?</p>

<p>Here’s how <code class="language-plaintext highlighter-rouge">BINARY_OP_ADD_INT</code> looks with tail calling on VS 2026 (again,
no PGO):</p>

<pre><code class="language-C">                if (!_PyLong_CheckExactAndCompact(left_o)) {
00007FFC67164785  cmp         qword ptr [rax+8],rdx  
00007FFC67164789  jne         _TAIL_CALL_BINARY_OP_ADD_INT@@_A+149h (07FFC67164879h)  
00007FFC6716478F  mov         r9,qword ptr [rax+10h]  
00007FFC67164793  cmp         r9,10h  
00007FFC67164797  jae         _TAIL_CALL_BINARY_OP_ADD_INT@@_A+149h (07FFC67164879h) 
...
                res = _PyCompactLong_Add((PyLongObject *)left_o, (PyLongObject *)right_o);
00007FFC6716479D  mov         eax,dword ptr [rax+18h]  
00007FFC671647A0  and         r9d,3  
00007FFC671647A4  and         r8d,3  
00007FFC671647A8  mov         edx,1  
00007FFC671647AD  sub         rdx,r9  
00007FFC671647B0  mov         ecx,1  
00007FFC671647B5  imul        rdx,rax  
00007FFC671647B9  mov         eax,dword ptr [rbx+18h]  
00007FFC671647BC  sub         rcx,r8  
00007FFC671647BF  imul        rcx,rax  
00007FFC671647C3  add         rcx,rdx  
00007FFC671647C6  call        medium_from_stwodigits (07FFC6706E9E0h)  
00007FFC671647CB  mov         rbx,rax  
...
                PyStackRef_CLOSE_SPECIALIZED(value, _PyLong_ExactDealloc);
00007FFC671647EB  test        bpl,1  
00007FFC671647EF  jne         _TAIL_CALL_BINARY_OP_ADD_INT@@_A+0ECh (07FFC6716481Ch)  
00007FFC671647F1  add         dword ptr [rbp],0FFFFFFFFh  
00007FFC671647F5  jne         _TAIL_CALL_BINARY_OP_ADD_INT@@_A+0ECh (07FFC6716481Ch)  
00007FFC671647F7  mov         rax,qword ptr [_PyRuntime+25F8h (07FFC675C45F8h)]  
00007FFC671647FE  test        rax,rax  
00007FFC67164801  je          _TAIL_CALL_BINARY_OP_ADD_INT@@_A+0E4h (07FFC67164814h)  
00007FFC67164803  mov         r8,qword ptr [_PyRuntime+2600h (07FFC675C4600h)]  
00007FFC6716480A  mov         edx,1  
00007FFC6716480F  mov         rcx,rbp  
00007FFC67164812  call        rax  
00007FFC67164814  mov         rcx,rbp  
00007FFC67164817  call        _PyLong_ExactDealloc (07FFC67073DA0h) 
</code></pre>

<p>Would you look at that, suddenly our trivial functions get inlined :).</p>

<p>You might also say, surely this does not happen on PGO builds? Well the issue
I linked above actually says it does! So yeah happy days.</p>

<p>Once again I want to stress, this is not the compiler’s fault! It’s just that
the CPython interpreter loop is not the best thing to optimize.</p>

<h3 id="how-do-i-try-this-out">How do I try this out?</h3>

<p>Unfortunately, for now, you will have to build from source.</p>

<p>With VS 2026, after cloning CPython, for a release build with PGO:</p>

<div class="language-powershell highlighter-rouge"><div class="highlight"><pre class="highlight"><code><span class="nv">$</span><span class="nn">env</span><span class="p">:</span><span class="nv">PlatformToolset</span><span class="w"> </span><span class="o">=</span><span class="w"> </span><span class="s2">"v145"</span><span class="w">
</span><span class="o">.</span><span class="n">/PCbuild/build.bat</span><span class="w"> </span><span class="nt">-p</span><span class="w"> </span><span class="nx">x64</span><span class="w"> </span><span class="nt">--tail-call-interp</span><span class="w"> </span><span class="nt">--pgo</span><span class="w">
</span></code></pre></div></div>

<p>Hopefully, we can distribute this in an easier binary form in the future
once Python 3.15’s development matures!</p>

<h1 id="addendum--edits">Addendum &amp; Edits</h1>

<p>I was asked for a cross-compiler test. So here’s a quick and dirty toy benchmark of pystones. The last row is the tail call enabled build. All configurations have PGO.
On this toy benchmark, we get roughly a 30% uplift.
Note that this is unscientific as it was only a sample size of 1 and I cannot disable Turbo Boost on my laptop on Windows for some reason.</p>

<table>
  <thead>
    <tr>
      <th>Compiler</th>
      <th>PlatformToolSet</th>
      <th>Pystones/second (higher is better)</th>
    </tr>
  </thead>
  <tbody>
    <tr>
      <td>VS2019</td>
      <td>142</td>
      <td>677544</td>
    </tr>
    <tr>
      <td>VS2022</td>
      <td>143</td>
      <td>710773</td>
    </tr>
    <tr>
      <td>VS2026</td>
      <td>145</td>
      <td>682089</td>
    </tr>
    <tr>
      <td>VS2026+TC</td>
      <td>145</td>
      <td>970306</td>
    </tr>
  </tbody>
</table>

<p>Chris Eibl has done excellent work benchmarking tail calling on various 
configurations and processors. The <a href="https://gist.github.com/chris-eibl/fade55faaad97e2cd12f5587ac1f4aa0">results</a> on Windows suggest between 
15-20% improved performance on a AMD Ryzen 7 5800X with Visual Studio 2026,
on CPython <code class="language-plaintext highlighter-rouge">main</code> branch, with a range of -11–55% speedups on
the individual benchmarks.</p>

<p><img src="/media/5800X-msvc.pgo2-vs-msvc.pgo.tc.svg" alt="Chris' results" /></p>]]></content><author><name>Ken Jin</name></author><summary type="html"><![CDATA[Python 3.15’s interpreter for Windows x86-64 should hopefully be 15% faster]]></summary></entry><entry><title type="html">A Plan for 5-10%* Faster Free-Threaded JIT by Python 3.16</title><link href="https://fidget-spinner.github.io/posts/faster-jit-plan.html" rel="alternate" type="text/html" title="A Plan for 5-10%* Faster Free-Threaded JIT by Python 3.16" /><published>2025-11-08T00:00:00+00:00</published><updated>2025-11-08T00:00:00+00:00</updated><id>https://fidget-spinner.github.io/posts/faster-jit-plan</id><content type="html" xml:base="https://fidget-spinner.github.io/posts/faster-jit-plan.html"><![CDATA[<h1 id="a-plan-for-5-10-faster-free-threaded-jit-by-python-316">A Plan for 5-10%* Faster Free-Threaded JIT by Python 3.16</h1>

<p>08-Nov-2025</p>

<p>During the Python Core Dev Sprint in Cambridge hosted by ARM, we planned to make the JIT in CPython 5% faster by 3.15 and 10% faster by 3.16. The planners present were Savannah Ostrowski, Mark Shannon, Ken Jin (me), Diego Russo and Brandt Bucher. We were accompanied by other CPython core team members as well.</p>

<p>You might wonder: 5% seems awfully conservative. However, note that this figure is the <em>geometric mean</em>. The number can range from slower to significantly faster. All numbers are <a href="https://github.com/python/pyperformance">pyperformance</a> figures.</p>

<p>In my <a href="/posts/jit-reflections.html">previous blog post</a>, I talked about the Python 3.13 and 3.14 JIT’s state. We’re planning to change that for 3.15 and 3.16.</p>

<h2 id="the-plan-for-315">The Plan for 3.15</h2>
<p>This is a paraphrase of what Savannah laid out <a href="https://github.com/python/cpython/issues/139038">here</a>. The difference is that I’m listing things in chronological order of what I expect will be merged into CPython.</p>

<ol>
  <li>Profiling support via LLVM 21.</li>
  <li>Trace recording JIT.</li>
  <li>Better machine code.</li>
  <li>Register allocation/Top-of-Stack Caching.</li>
  <li>Reference count elimination.</li>
  <li>More constant promotion.</li>
  <li>Basic Free threading support.</li>
</ol>

<h3 id="profiling-support-via-llvm-21">Profiling support via LLVM 21</h3>

<p>Profiling and debugger support is a must-have if we want the JIT to be production-ready. The JIT uses <a href="https://dl.acm.org/doi/10.1145/3485513">Copy-and-patch</a> compilation to create its templates/stencils. Thanks to Savannah, we have support for <a href="https://github.com/python/cpython/issues/136895">LLVM 20</a> and soon LLVM 21. LLVM 21 in theory should allow us to support stack unwinding through the JIT frames. This would allow debuggers and other tools to see the JIT code as a single frame. Currently the debugger I use gets lost when it tries to introspect JIT code.</p>

<p>I can’t explain more, because I don’t know anything about debuggers and profilers :(.</p>

<h3 id="trace-recording-jit">Trace recording JIT</h3>

<p>Our current JIT region selection algorithm could be improved. Here’s the current pipeline:</p>

<p><img src="/media/jit-flowchart.svg" alt="CPython's JIT Pipeline" /></p>

<p>The <em>region selector</em>, aka. the JIT frontend, uses <em>trace projection</em>. In short, we guess where the traces will go, and use historical data from the interpreter’s <a href="https://en.wikipedia.org/wiki/Inline_caching">inline caches</a> to feed type information into our IR.</p>

<p>There are two problems with the above:</p>
<ol>
  <li>CPython’s inline caches are <a href="https://en.wikipedia.org/wiki/Inline_caching#Monomorphic_inline_caching">monomorphic</a> to save space. We thus have little concept of distributions or historical data. The only information we have is “cache hit” or “cache miss”. This causes historical data to be stale/contradictory in our IR very often.</li>
  <li>We need a lot of interpreter involvement to record where our code will execute next. For example, if we saw a call, we would inline the call into the call site based on the inline cache entry information. However, this is a best-effort guess due to the previous point. Generators are completely unhandled. Custom dunders are punted. You get the point.</li>
</ol>

<p>Other tracing JIT compilers like PyPy and TorchDynamo (<code class="language-plaintext highlighter-rouge">torch.compile</code>). Use some form of trace recording. This is not entirely true for TorchDynamo, as that seems to introspect values then do a symbolic interpretation over the bytecode. However, the key point is that live up-to-date information is present in both these systems.</p>

<p>At the core dev sprint, Brandt nerd-sniped me to rewrite the entire JIT frontend. Using my free time in the past 2 months, I have done so. The <a href="/media/bm-20251108-vultr-x86_64-Fidget%252dSpinner-tracing_jit-3.15.0a1+-7e2bc1d-vs-base.png">preliminary results</a> are: 1k more loc, roughly 1.5% faster geometric mean average on pyperformance. 100% faster (!!! hopefully not a <a href="./apology-tail-call.md">bug</a>) on the most improved benchmark (richards), and 15% slower on the slowest benchmark. The new JIT frontend now also supports generators (partially), custom dunders, object initialization, etc.</p>

<p><img src="/media/tracing_jit_benchmarks.png" alt="Tracing JIT Comiler pyperformance benchmarks" />
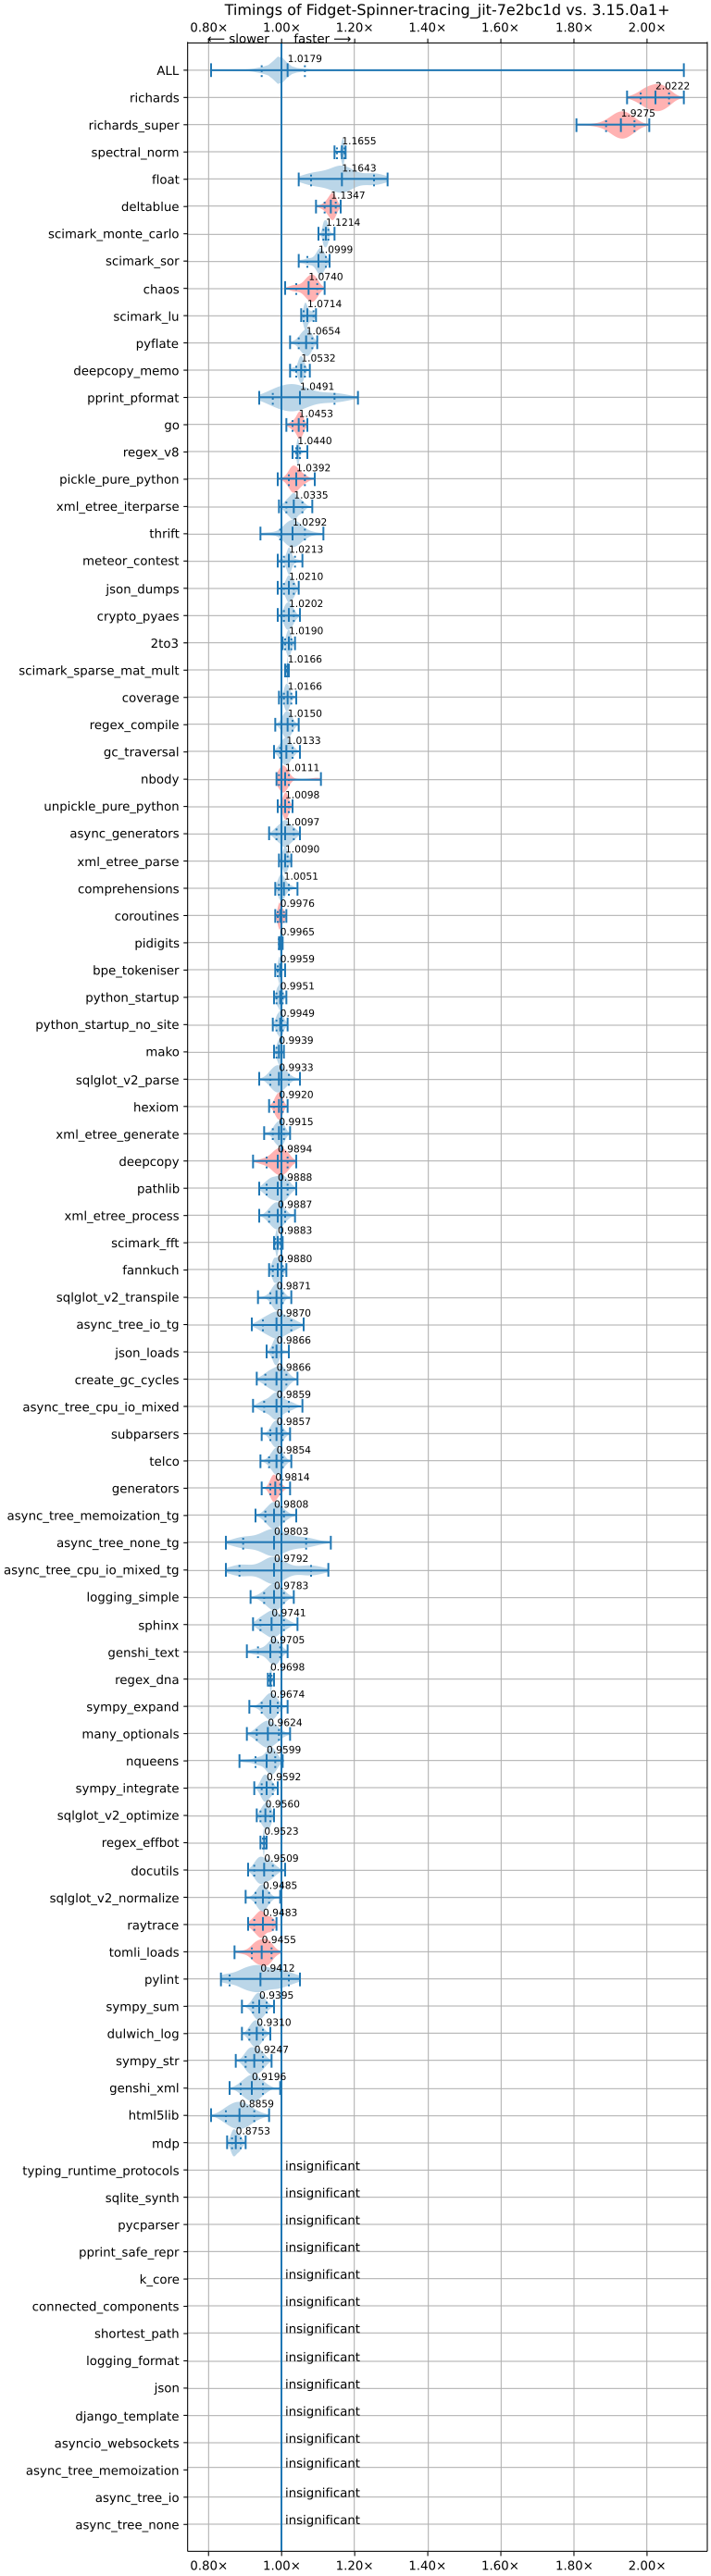
(Image credits to Meta’s Free-Threading Benchmarking Runner). Anything below 1.00x on the graph is a slowdown.</p>

<p>The details of the implementation are quite interesting to me, so you might want to give the <a href="https://github.com/python/cpython/pull/140310">PR</a> a read. The key idea is to maintain two dispatch tables in a mechanism I call “dual dispatch”. One table is the standard interpreter, the other is the tracing interpreter. we (ab)use computed gotos/tail calling to dispatch from one table to the other.</p>

<h3 id="better-machine-code-generation">Better machine code generation</h3>

<p>Copy-and-Patch allows us to generate machine code templates with little effort. However, the base implementation of it without much optimizations does not yield much speedup on CPython. In the original paper, the Copy-and-Patch authors implemented other transformations in LLVM to produce better code for the JIT. We will be doing something similar.</p>

<p>Mark and Diego are working on better codegen for AArch64. For example, see <a href="https://github.com/python/cpython/issues/140683">#140683</a>, <a href="https://github.com/python/cpython/issues/139757">#139757</a>.</p>

<p>Brandt is also working on better code generation in general. The most interesting one (in my opinion) comes from the Copy-and-Patch paper which is to rearrange assembly control-flow to optimize the chances of things falling-through. In Brandt’s <a href="https://github.com/python/cpython/issues/135904">issue</a>, he invertes branches in assembly code to increase the chance of that. The idea is pretty simple, but produces a 1% geometric mean speedup on pyperformance. Here’s how it looks like. If you have the following assembly (example taken from the issue):</p>

<pre><code class="language-asm">cmpq    $0x1, -0x10(%r13)
je      _JIT_CONTINUE
jmp     _JIT_JUMP_TARGET
</code></pre>

<p><code class="language-plaintext highlighter-rouge">_JIT_CONTINUE</code> points to the next micro-operation to execute. <code class="language-plaintext highlighter-rouge">_JIT_JUMP_TARGET</code> points to a deoptimization target. The hot main path is <code class="language-plaintext highlighter-rouge">_JIT_CONTINUE</code> and the cold path in the bad case is <code class="language-plaintext highlighter-rouge">_JIT_JUMP_TARGET</code>. You can optimize it to look like this instead:</p>

<pre><code class="language-asm">cmpq    $0x1, -0x10(%r13)
jne      _JIT_JUMP_TARGET
</code></pre>

<p>This has the effect of causing the JIT to “fall-through” to the next instruction without any jumps. The jump is only taken in the uncommon deoptimization path! This means in the hot path, no jumps are taken. Modern branch predictors are quite complex, but it seems this performs better (at least on our benchmarks) on our hardware versus the old code.</p>

<p>Another idea is hot-cold splitting, but we don’t have PR up for that yet, so you’ll have to read the issue above!</p>

<h3 id="register-allocationtop-of-stack-caching">Register allocation/Top-of-stack caching</h3>

<p>Register allocation is likely one of the most worthwhile optimizations a compiler can do. The CPython bytecode interpreter is a <em>stack machine</em>. This means it pushes and pops from an operand stack instead of registers when performing computation. Think of an infinite register machine, but everything lives on the stack.</p>

<p>For obvious reasons, the stack is slower than registers. Luckily in 1995, Anton Ertl proposed a <a href="https://dl.acm.org/doi/10.1145/207110.207165">solution</a> to cache the stack in registers. The key idea is to maintain a state machine of the stack. State transitions are loads/spills from registers to the stack and vice versa. Each state represents what is in the stack and what is in registers. Note that this state machine need only be maintained by the JIT optimizer. After the analysis pass, it need not be kept around.</p>

<p>Mark is working on <a href="https://github.com/python/cpython/issues/135379">this</a>. We aren’t as advanced as what Ertl proposes in the paper. However it’s a good start. The preliminary results are roughly a 0.5% geometric mean speedup on pyperformance, with the highest speedup on nbody at 16%. You might be surprised that this number isn’t higher. More on that in the next paragraph.</p>

<p>The main problem is actually due to CPython’s reference count semantics. Simply put, CPython tracks object’s liveness using reference counting and tracing garbage collection. The problem with this is that Python supports arbitrary finalizers (<code class="language-plaintext highlighter-rouge">__del__</code>). This means anywhere that decrements a reference count could call arbitrary Python code, mandating a register spill as the garbage collector treats the stack as one of its roots.</p>

<p>For example, in Python C API, the seemingly innocuous:</p>

<div class="language-plaintext highlighter-rouge"><div class="highlight"><pre class="highlight"><code>LOAD x
LOAD y
ADD (+)
</code></pre></div></div>

<p><code class="language-plaintext highlighter-rouge">ADD</code> normally needs to decrement the reference count of all its input operands, thus we are forced to spill there. There is a solution however, and that’s the next section!</p>

<h3 id="reference-count-elimiation">Reference count elimiation</h3>

<p>Thanks to work on Free-Threading (nogil) by Matt Page @ Meta, CPython’s bytecode optimizer in 3.14 does a simple pass to avoid reference counting local variables. The idea is that if a local variable lives in a CPython function object, then it has a reference to it that will outlive its temporary stack lifetime. In that case, skip the reference counting altogether. More details in the PR <a href="https://github.com/python/cpython/pull/130708">here</a>. Interestingly, this PR uses <a href="https://en.wikipedia.org/wiki/Tagged_pointer">tagged pointers</a> which I was paid to <a href="https://github.com/python/cpython/pull/118450">implement</a> by Quansight Labs (thanks Quansight and Meta!) in CPython.</p>

<p>To summarise, the previous</p>

<div class="language-plaintext highlighter-rouge"><div class="highlight"><pre class="highlight"><code>LOAD x
LOAD y
ADD (+)
</code></pre></div></div>

<p>now becomes</p>

<div class="language-plaintext highlighter-rouge"><div class="highlight"><pre class="highlight"><code>LOAD_BORROW x
LOAD_BORROW y
ADD (+)
</code></pre></div></div>

<p>Note that thanks to the base bytecode compiler, we now have enough information to perform a <a href="https://en.wikipedia.org/wiki/Data-flow_analysis">data-flow analysis</a> pass to do simple lifetime analysis of objects on the stack! We can trivially observe that anything coming from a <code class="language-plaintext highlighter-rouge">_BORROW</code> must have a strong reference somewhere keeping it alive. Therefore, we can convert the ADD instruction to a form which does no reference counting:</p>

<div class="language-plaintext highlighter-rouge"><div class="highlight"><pre class="highlight"><code>LOAD_BORROW x
LOAD_BORROW y
ADD_NO_REFCOUNT (+)
</code></pre></div></div>

<p>I implemented the pass to do the lifetime analysis in CPython’s JIT optimizer <a href="https://github.com/python/cpython/issues/134584">earlier this year</a>  in CPython. However, as almost no bytecodes are converted yet, we don’t see a speedup. We do see a speedup in microbenchmarks such as nbody of about <a href="https://github.com/python/cpython/pull/135465#issuecomment-3009304472">6%</a>. The key idea however, is that this now unblocks the register allocator, allowing it to do this:</p>

<div class="language-plaintext highlighter-rouge"><div class="highlight"><pre class="highlight"><code>LOAD_BORROW_REG_0_1 x
LOAD_BORROW_REG_1_2 y
ADD_NO_REFCOUNT_REG_2_0 (+)
</code></pre></div></div>

<p>With zero spills (if we are lucky and don’t run out of registers)! This optimization is thus in some sense, a <a href="https://en.wikipedia.org/wiki/Canonicalization">canonicalization</a> pass—it unlocks optimizations for other passes, while optimizing a little on its own.</p>

<h3 id="more-constant-promotion">More constant promotion</h3>
<p>One key optimization in JIT compilers is constant propagation. In effect, something like</p>
<div class="language-plaintext highlighter-rouge"><div class="highlight"><pre class="highlight"><code>x = 1
y = 1
z = x + y
</code></pre></div></div>

<p>becomes:</p>

<div class="language-plaintext highlighter-rouge"><div class="highlight"><pre class="highlight"><code>x = 1
y = 1
z = 2
</code></pre></div></div>

<p>Note that <code class="language-plaintext highlighter-rouge">x</code> and <code class="language-plaintext highlighter-rouge">y</code> can be optimized away, but that is usually another associated optimization called <em>copy propagation</em>.</p>

<p>The JIT currently has a limited form of constant propagation. However, to really perform more, it needs to maintain a <em>pool</em> of constants like in Java or PyPy.</p>

<p>The syntax takes ideas from PyPy, but in RPython, you can promote a value to a trace-level constant:</p>
<div class="language-plaintext highlighter-rouge"><div class="highlight"><pre class="highlight"><code>x = hint(x, promote=True)
</code></pre></div></div>

<p>Which will cause x’s value at the time to be embedded into the trace itself, allowing the optimizer to go ham!</p>

<p>I plan to add that in this <a href="https://github.com/python/cpython/pull/140968">PR</a>.</p>

<h3 id="basic-free-threading-support">Basic Free-Threading support</h3>

<p>Free-threading is taking off, but the current JIT doesn’t work with it yet.</p>

<p>The ideas for this are still a little nebuluous, but over the summer I had the fortune of contributing a little to ZJIT, Ruby’s new JIT compiler, with help from Max Bernstein. It was a load of fun and I learnt a lot. Perhaps the most interesting thing is the idea of <code class="language-plaintext highlighter-rouge">PatchPoint</code> and <code class="language-plaintext highlighter-rouge">Ractors</code>.  I’m basically borrowing Ruby’s ideas here!</p>

<p>Ruby has had the nogil problem for their JIT compilers for ages. One way of making sure single-threaded-assumption optimizations still work is to add a watcher in the code (CPython’s implementation was upstreamed from <a href="https://github.com/facebookincubator/cinder">Cinder</a>, Instagram’s JIT compiler for Python). This watcher is essentially a callback to invalidate something once an assumption holds true. This sounds not very concrete, but consider the following micro-operation trace:</p>

<div class="language-plaintext highlighter-rouge"><div class="highlight"><pre class="highlight"><code>_CHECK_VALIDITY
# ... optimized that assumes single-threaded mode
</code></pre></div></div>

<p>We then insert into the <code class="language-plaintext highlighter-rouge">thread_create</code> in CPython:</p>

<div class="language-plaintext highlighter-rouge"><div class="highlight"><pre class="highlight"><code>thread_create()
{
    invalidate_all_jit_code();
    ...
}
</code></pre></div></div>

<p>Because the JIT checks for <code class="language-plaintext highlighter-rouge">invalidate_all_jit_code</code> contains a callback to invalidate <code class="language-plaintext highlighter-rouge">_CHECK_VALIDITY</code>. Which is checked by our JIT code everytime it’s run. This is just a cheap boolean flag check. This means when a thread is created, we throw all our JIT code away. Single threaded code runs at JIT speed, multi-threaded code runs slower but at least has the benefit of the GIL off.</p>

<p>This seems wasteful for now, but I did say <strong>basic</strong> free-threading support. There are more advanced schemes available! Such as discarding and then recompiling in a multi-thread optimization mode where we only turn on safe optimizations. That’s only planned for 3.16 though. We’re taking small steps.</p>

<h3 id="conclusion">Conclusion</h3>

<p>If you like this sort of thing, or even if you don’t, consider contributing to CPython! For now, we don’t have easy contributor issues yet as we are waiting to land the initial stages of the trace recording JIT and the register allocator. After that, probably the start of next year, there will be tons of things for people to contribute to! Contribution doesn’t have to be code either, good reviews are always appreciated.</p>

<h3 id="acknowledgements">Acknowledgements</h3>

<p>I thank Mark and Savannah for always reviewing my PRs :).</p>]]></content><author><name>Ken Jin</name></author><summary type="html"><![CDATA[A Plan for 5-10%* Faster Free-Threaded JIT by Python 3.16]]></summary></entry><entry><title type="html">Reflections on 2 years of CPython’s JIT Compiler—The good, the bad, the ugly</title><link href="https://fidget-spinner.github.io/posts/jit-reflections.html" rel="alternate" type="text/html" title="Reflections on 2 years of CPython’s JIT Compiler—The good, the bad, the ugly" /><published>2025-07-05T00:00:00+00:00</published><updated>2025-07-05T00:00:00+00:00</updated><id>https://fidget-spinner.github.io/posts/jit-reflections</id><content type="html" xml:base="https://fidget-spinner.github.io/posts/jit-reflections.html"><![CDATA[<h1 id="reflections-on-2-years-of-cpythons-jit-compiler-the-good-the-bad-the-ugly">Reflections on 2 years of CPython’s JIT Compiler: The good, the bad, the ugly</h1>

<p>5 July 2025</p>

<p>This blog post includes my honest opinions on the CPython JIT. What I think we did well,
what I think we could have done better. I’ll also do some brief qualititative
analysis.</p>

<p>I’ve been working on CPython’s JIT compiler since before the very start.
I don’t know how long that is at this point … 2.5, maybe almost 3 years?
Anyways, I’m primarily responsible for Python’s JIT compiler’s
<a href="https://docs.python.org/3.13/whatsnew/3.13.html#an-experimental-just-in-time-jit-compiler">optimizer</a>.</p>

<p>Note that at this point of time, the JIT is still experimental. This means 
it’s not ready for prime time yet: this blog post may go out of date
fairly quickly!</p>

<h2 id="heres-a-short-summary">Here’s a short summary:</h2>

<p>The good:</p>
<ol>
  <li>I think we’re starting to build a community around the JIT, which is great.</li>
  <li>The JIT is also <strong>teachable</strong>. We have newcomers coming in and contributing.</li>
</ol>

<p>Could use improvement:</p>
<ol>
  <li>Performance</li>
  <li>Inaccurate coverage of the JIT</li>
</ol>

<h2 id="good-a-community-driven-jit">Good: A community-driven JIT</h2>

<p>CPython’s JIT is community-driven at this point. You may have heard
of the layoffs at Microsoft affecting the Faster CPython team. However,
my underestanding is that from the very start, the JIT was meant to be
a community project.</p>

<p>This wasn’t always the case. When the JIT started out, it was practically
only Brandt working on the machine code generator. I had help from Mark (Shannon)
and Guido in landing the initial optimizer, but after that it was mostly me.
Later I got busier with school work and Brandt became the sole contributor to
the optimizer for a few months or so. Those were dark times.</p>

<p>I’m really happy to say that we have more contributors today though:</p>
<ul>
  <li>Savannah works on the machine code generator, reproducible JIT stencils, and 
sometimes the optimizer.</li>
  <li>Tomáš works on the optimizer and is a codeowner of it!</li>
  <li>Diego works on the machine code generator to improve it on ARM, and sometimes
the optimizer.</li>
  <li>We also have various drive-by contributors. Zheaoli, Noam and Donghee are 
names that I remember. Though I’m definitely missing a few names here.</li>
</ul>

<p>This community building was somewhat organic, but also very intentional. We
actively tried to make the JIT easier to work on. If you dig up past discussions,
one of Mark’s arguments for a tracing JIT was easier static analysis. This easiness
isn’t just that it doesn’t require a meet or join in general or that it requires
only a single pass, but more that static anlaysis of a single basic block is
easier to teach than a whole control-flow graph.</p>

<p>We also actively welcome people to work on the JIT with us. CPython doesn’t have much
optimizing compiler expertise interested in working on the JIT. We have some compiler
people, but the subset of those interested in working on the JIT is even smaller. So
we aim to train up people even if they don’t have any background in compilers.</p>

<h2 id="good-a-teachable-jit">Good: A teachable JIT</h2>

<p>As I mentioned earlier, tracing was one decision to make the JIT easier to teach.
There are a few other design decisions too, but those will be their own blog post.
So I’m not talking about them here.</p>

<h2 id="could-be-improved-performance">Could be improved: Performance</h2>

<p>CPython 3.13’s JIT ranges from slower to the interpreter
to roughly equivalent to the interpreter.
Calling a spade a spade: CPython 3.13’s JIT is slow. It hurts me to say this considering
I work on it, but I don’t want to sugarcoat my words here.</p>

<p>The argument at the time was that it was a new feature and we needed to lay the foundations
and test the waters. You might think that surely, CPython 3.14’s JIT is a lot faster right?
In some ways, the JIT has become faster, but only in select scenarios.
The answer is again… complicated. When using a modern compiler like Clang 20
to build CPython 3.14, I often found the interpreter outperforms the JIT. The JIT only really starts reaching
parity or outperforming the interpreter if we use an old compiler like GCC 11 to build the interpreter.
However, IMO that’s not entirely fair to the interpreter, as we’re purposely limiting it by using a compiler
we <em>know</em> is worse for it. You can see this effect very clearly on Thomas Wouter’s analysis
<a href="https://github.com/Yhg1s/python-benchmarking-public">here</a>. Note that this is the geometric mean. So there are select workloads where the JIT does show a real speedup!</p>

<p><img src="/media/jit-reflections-perf.png" alt="Performance of JIT Compiler across different compilers, Credit Thomas Wouters" />
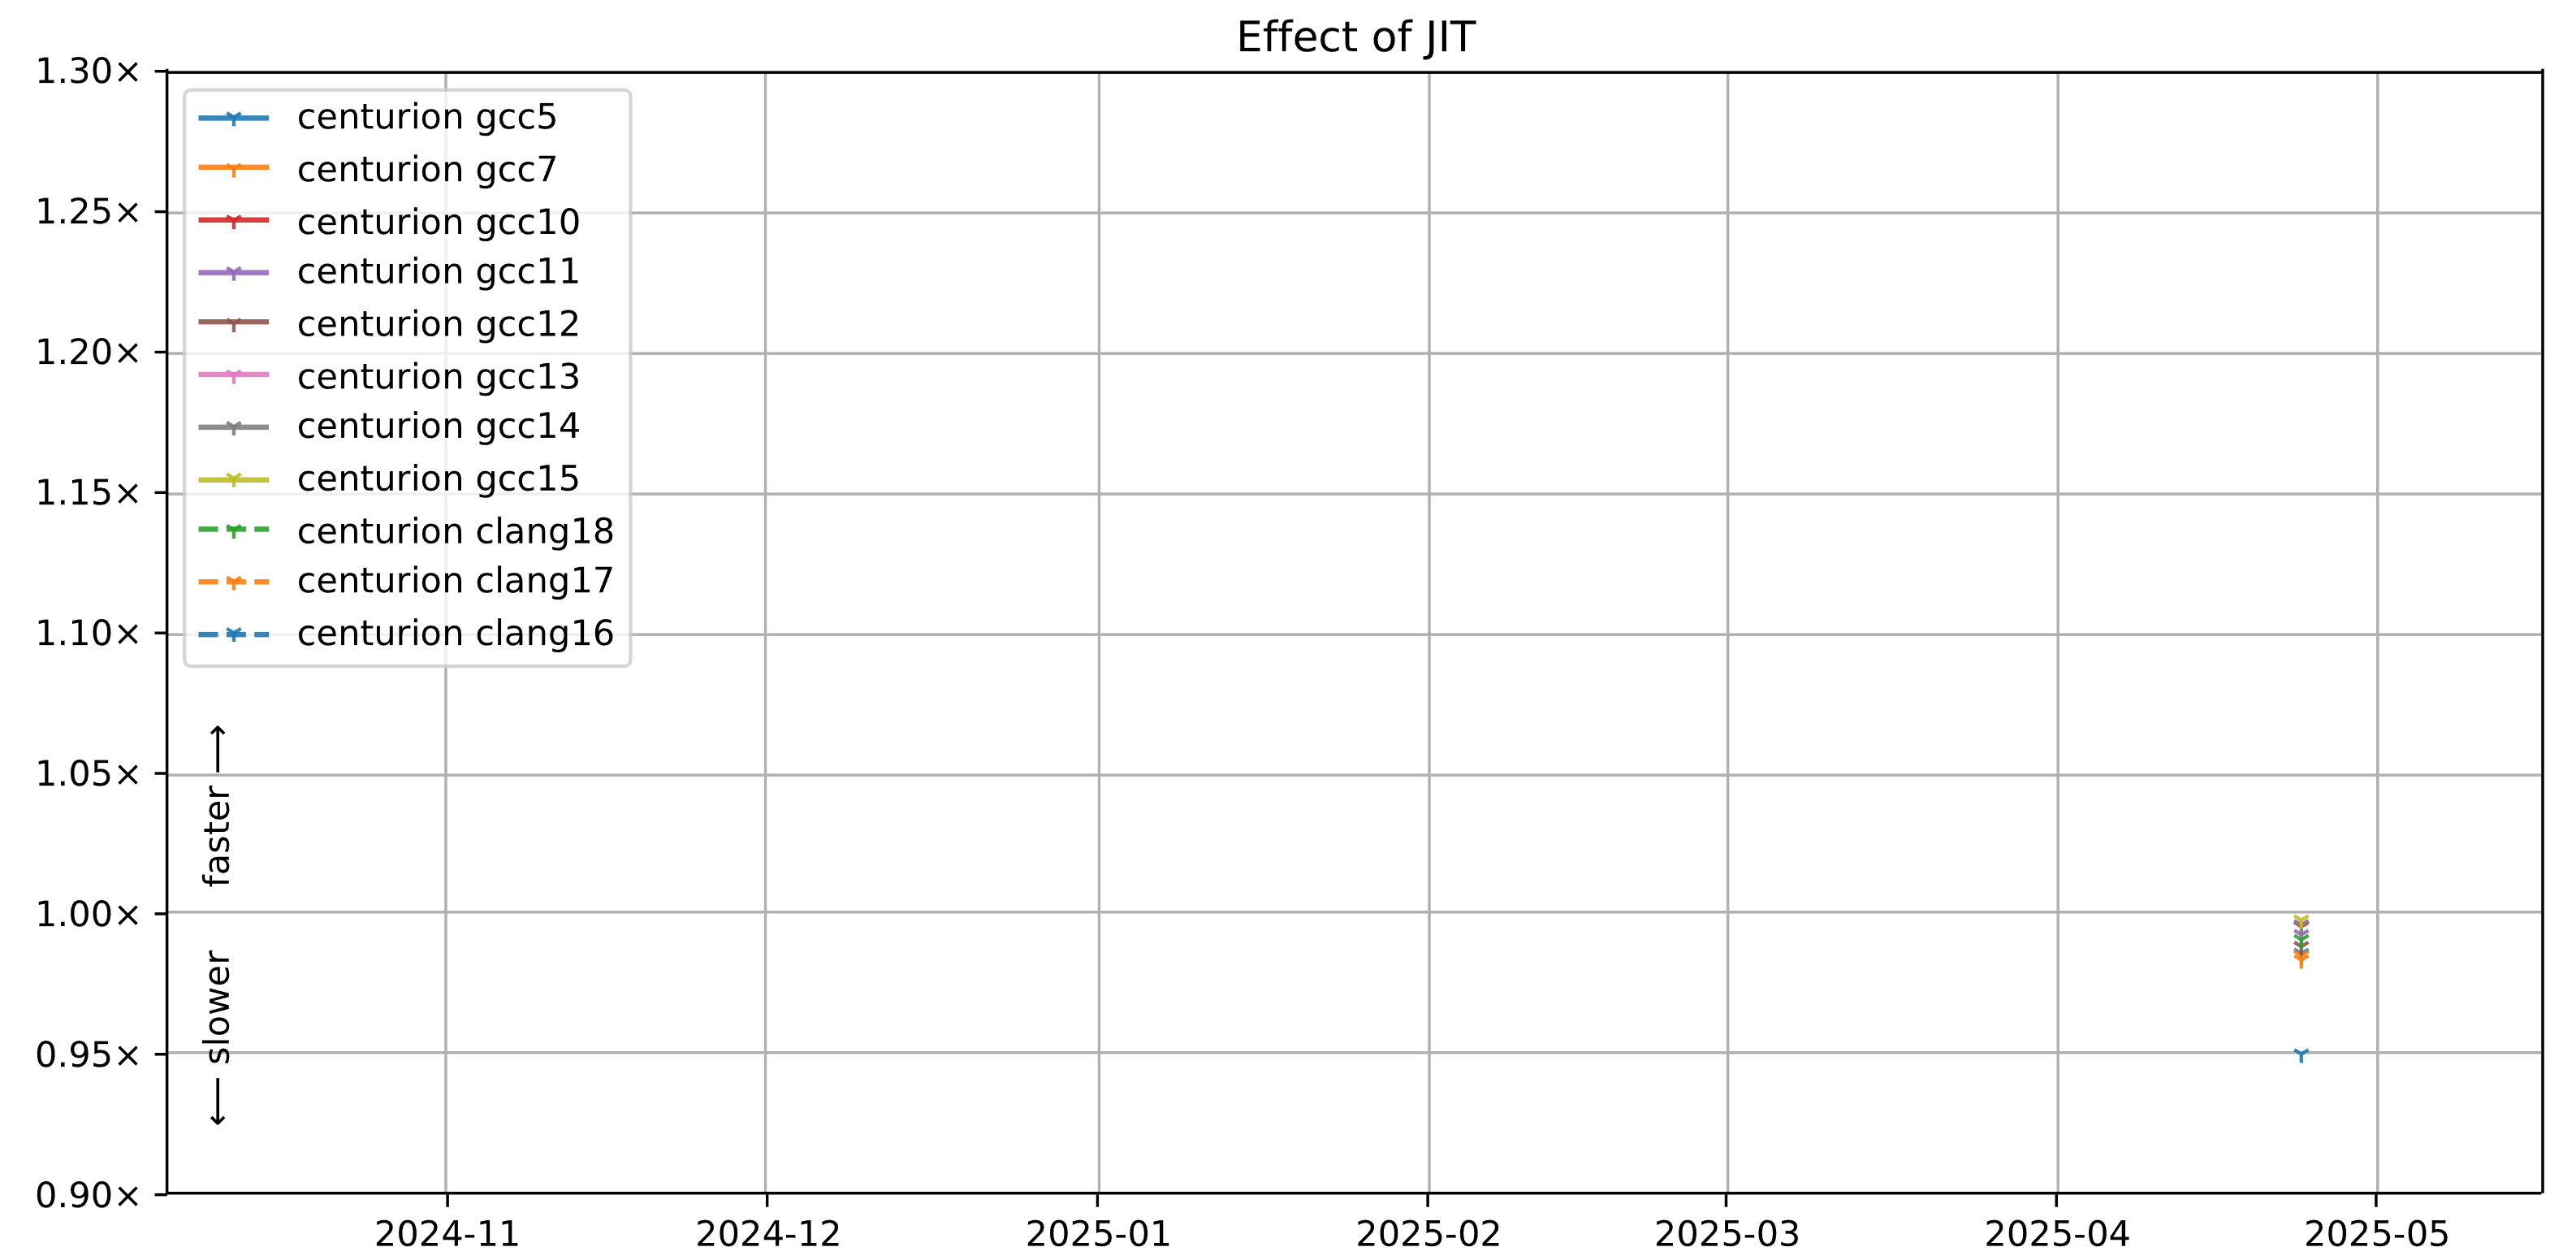
(Image credits to Thomas Wouters). Anything below 1.00x on the graph is a slowdown.</p>

<p>In short, the JIT is almost always slower
than the interpreter if you use a modern compiler. This also assumes the interpreter doesn’t get hit
by random performance bugs on the side (which has happened many times now).
<strong>Note: this result only applies to our x64 benchmarks.</strong>
<strong>I cannot conclude anything about AArch64, which has been improving over time.</strong></p>

<p>In some cases, we do see significant speedups (up to ~20%) in certain 
benchmarks. Indicating that some progress has been made on 3.14. Which is a 
good thing! What we’re tackling is that the performance 
is a mixed bag and often not very predictable. In the
<a href="https://github.com/python/pyperformance/blob/main/pyperformance/data-files/benchmarks/bm_richards/run_benchmark.py">richards</a> benchmark, we see a ~20% speedup,
but on the
<a href="https://github.com/python/pyperformance/blob/main/pyperformance/data-files/benchmarks/bm_nbody/run_benchmark.py">nbody</a>
benchmark, we see a ~10% slowdown on my system, and a smaller slowdown for
the
<a href="https://github.com/python/pyperformance/blob/main/pyperformance/data-files/benchmarks/bm_spectral_norm/run_benchmark.py">spectralnorm</a> benchmark.
All of these are known 
to be loop-heavy artificial benchmarks, which V8 has since
<a href="https://v8.dev/blog/real-world-performance">ditched</a> so in theory, they all 
should see a speedup, but they don’t, which is strange.</p>

<div class="language-plaintext highlighter-rouge"><div class="highlight"><pre class="highlight"><code>3.14 JIT Off:
richards: Mean +- std dev: 44.5 ms +- 0.5 ms
nbody: Mean +- std dev: 91.8 ms +- 3.5 ms
spectral_norm: Mean +- std dev: 90.6 ms +- 0.7 ms

3.14 JIT On:
richards: Mean +- std dev: 37.8 ms +- 2.4 ms
nbody: Mean +- std dev: 104 ms +- 2 ms
spectral_norm: Mean +- std dev: 96.0 ms +- 0.7 ms
</code></pre></div></div>
<p>System/Build configuration: Ubuntu 22.04, Clang 20.1.7, PGO=true, LTO=thin, tailcall=false. Tuned with <code class="language-plaintext highlighter-rouge">pyperf system tune</code>.</p>

<p>You might ask: why is the 3.14 JIT not much faster? The real answer, which 
again hurts me to say is that the 3.14 JIT has almost no major <em>optimizer</em>* 
features over 3.13. In 3.14, we were mostly expanding the existing types 
analysis pass to cover more bytecodes. We were also using that as a way to 
teach new contributors about the JIT and encourage contribution. In short, we 
were building up new talent. I personally think we were quite low on 
contributors at the start. I also had other commitments which made features 
that were supposed to go into the JIT not go in, which I’m sorry for. 
Personally, I think building up more talent over prioritizing immediate 
performance is the right choice for long-term sustainability of the JIT.</p>

<p>*<em>optimizer</em> = JIT optimizer, separate from the code generator.
The code generator for x64 and AArch64 has seen improvements.</p>

<h2 id="could-be-improved-inaccurate-coverage">Could be improved: Inaccurate coverage</h2>

<p>The initial media coverage of the 3.13 JIT got the numbers wrong by misinterpreting 
our results. There was this number 
of “2-9%” faster being spread around. I think the first 
major blog post that covered this was
<a href="https://tonybaloney.github.io/posts/python-gets-a-jit.html#is-it-faster">this one</a>. Note that I’m friends with the 
author of that post and I’m not trying to say that they did a bad job.
Conveying performance is a really hard job. One that I’m still struggling with 
<a href="./apology-tail-call.md">myself</a>. However, in good conscience, and as an 
aspiring scientist, I can’t stand by and watch people say the 3.13 JIT is “2-9%” 
faster than the intepreter. It’s really more nuanced than that (see section 
above). Often times, the CPython 3.13 JIT is a lot slower than the interpreter.
Furthermore, the linked comment is that the 3.13 JIT is 2-9% faster than the
<em>tier 2</em> interpreter. That’s the interpreter that executes our JIT 
intermediate representation by interpreting it, which is super slow. It’s not 
comparing to the actual CPython interpreter.</p>

<p>I’ve seen other sources repeat this number too. It frustrates me a lot. The 
problem with saying the 3.13 JIT is faster is that it sets the wrong 
expectations. Again, users on the Python Discourse forum and privately have 
shared performance numbers where the JIT is a significant regression for them.
This goes against the grain of what’s reported online. We do not have control over the numbers, but I still would like to clear the air on what the real expectation should be.</p>

<h2 id="ugly-none">Ugly: None</h2>

<p>If I had thought there were really ugly stuff, I wouldn’t be working on the JIT anymore :-).</p>

<h2 id="conclusion-and-looking-forward">Conclusion and looking forward</h2>

<p>I’m still hopeful for the JIT. As I mentioned above, we’ve built a significant 
community around it. We’re now starting to pick up momentum on issues and new 
optimizations that could bring single-digit percentage speedups to the JIT in 
3.15 (note: this is the geometric mean of our benchmarks, so real speedups 
might be greater or lesser). Brandt has already merged some
<a href="https://github.com/python/cpython/pull/135905">optimizations</a>
for the JIT’s machine code. I 
don’t want to bring unwanted attention to the other efforts for the moment. 
Just know this: there are multiple parallel efforts to improve the JIT now 
that we have a bigger community around it that can enable such work.
The road getting here has been tough, but there’s promise in our future.
We also really need help testing the JIT and getting more data for it.
Please try it out!</p>

<h2 id="correction-notice">Correction notice</h2>

<p>In a previous version of this blog post, I pointed out there were no major 
performance additions to the JIT in 3.14. When I said this, I was thinking of 
the JIT optimizer only, not the machine code generator. I am frankly 
underqualified to talk about the machine code generator. I have since updated 
the post to specify the optimizer. Furthermore, when I say <em>major</em>, I 
don’t meant to denigrate the efforts of our contributors. I had planned for 
certain major features to enter the CPython JIT in 3.14, but missed them due 
to my own lack of time. So I’m not pointing blaming anyone here other than 
myself.</p>

<p>The (lack-of) performance gains for the JIT are for architectures that 
I observed (mostly a range of x64 processors). It is possible that some 
architectures have real gains that I’m not aware of.</p>

<p>I also added some benchmarks run on my system, where I show a speedup in some 
workloads, but a slowdown in others.</p>]]></content><author><name>Ken Jin</name></author><summary type="html"><![CDATA[Reflections on 2 years of CPython’s JIT Compiler: The good, the bad, the ugly]]></summary></entry><entry><title type="html">I’m Sorry for Python’s tail-calling Interpreter’s Results</title><link href="https://fidget-spinner.github.io/posts/apology-tail-call.html" rel="alternate" type="text/html" title="I’m Sorry for Python’s tail-calling Interpreter’s Results" /><published>2025-03-08T00:00:00+00:00</published><updated>2025-03-08T00:00:00+00:00</updated><id>https://fidget-spinner.github.io/posts/apology-tail-call</id><content type="html" xml:base="https://fidget-spinner.github.io/posts/apology-tail-call.html"><![CDATA[<h1 id="im-sorry-for-pythons-tail-calling-interpreters-results">I’m Sorry for Python’s tail-calling Interpreter’s Results</h1>

<p>08-Mar-2025</p>

<p>This is my first blog post ever. I want to use it to say
I’m truly sorry for communicating inaccurate results for
Python’s tail-calling interpreter. I take full personal 
responsibility for the oversight that led to it.</p>

<h2 id="what-happened">What happened?</h2>

<p>About a month ago, I <a href="https://github.com/python/cpython/pull/128718">merged</a> a new 
tail-calling interpreter into Python. That interpreter
reported a 9-15% performance boost on Python 3.14’s Whats New page.</p>

<p>These figures turned out to be inaccurate. Long story short,
the compiler we were using (Clang 19), had a bug that 
worsened our baseline performance. We (the CPython 
developers) were completely unaware of this bug.</p>

<p>The real performance uplift one can expect by upgrading
to the tail-calling interpreter is between the 3-5% range.
We are not too sure about this figure as well, because we
had to compare across different compilers.</p>

<p>Thanks to Nelson Elhage for their excellent investigation
into this issue and bringing it up. For more information, you can
read their blog post <a href="https://blog.nelhage.com/">here</a>.</p>

<h2 id="what-im-doing-to-fix-the-situation">What I’m doing to fix the situation</h2>

<p>Upon receiving news from Nelson confirming that the Clang 19 bug caused
a 10% performance regression on our baseline. I did the following:</p>

<ul>
  <li>Immediately pushed a <a href="https://github.com/python/cpython/pull/130908">PR</a> to <a href="https://docs.python.org/3.14/whatsnew/3.14.html#whatsnew314-tail-call">Python 3.14’s What’s New Page</a> to correct the record. I put a big attention markup in reStructuredText to signal to the reader that a correction has been made. This also gives credit to Nelson.</li>
  <li>Updated all my Reddit posts to add a disclaimer and link to the updated What’s New.</li>
  <li>For Twitter/X: I don’t have premium so I can’t edit my post. I’m thinking of posting a link to this blog post to let people know.</li>
</ul>

<p>If you feel there’s more I could do, please let me know.</p>

<h2 id="what-ive-learnt-from-this">What I’ve learnt from this</h2>

<p>This completely blindsided me and I’ve learnt to never trust
the compiler when the performance results are too good to be true.
That, and to carefully investigate our baselines.</p>

<p>At the time of writing, the Clang 19 <a href="https://github.com/llvm/llvm-project/issues/106846">bug</a>
I talked about is not yet fixed, and it exists in Clang 19, 20, maybe 21-beta. <strong>I do not want to blame the LLVM developers for this.</strong> Like me, they are probably volunteer contributors as well.
Sometimes we make mistakes.</p>

<h2 id="summary">Summary</h2>

<p>In short, a compiler bug in Clang 19 that we were unaware of
resulted in worse baselines. I reported these figures believing 
they were true. I should have done more investigation into the 
compiler before reporting these figures. I’m deeply sorry for
mistakenly reporting inaccurate numbers.</p>]]></content><author><name>Ken Jin</name></author><summary type="html"><![CDATA[I’m Sorry for Python’s tail-calling Interpreter’s Results]]></summary></entry></feed>